
21 Size Exclusion Chromatography
Learning Objectives
After completing this section, readers should be able to:
- Explain why molecular weight and molecular weight distribution are essential parameters in polymer science and why other characterization methods often fail to provide direct measurements of these properties.
- Describe the fundamental principles of Size Exclusion Chromatography, including the roles of the stationary phase and mobile phase within the system, as well as how the concept of hydrodynamic volume relates to SEC’s ability to separate molecules.
- Identify and explain the major components of an SEC system, including pumps, columns, injection systems, and the various detectors used to gather molecular weight information.
- Interpret SEC chromatograms, calculate molecular weight averages such as Mn, Mw, and Mz, understand the polydispersity index, and recognize chromatographic features that indicate branching, bimodal distributions, or polymer degradation.
- Evaluate the strengths and limitations of SEC as a polymer characterization technique, including its non-destructive nature, reproducibility, and challenges such as solubility issues and calibration constraints.
- Apply SEC concepts to real polymer systems by understanding how molecular weight data supports research in polymer synthesis, degradation studies, nanocomposite design, and advanced materials characterization.
Introduction
Polymers possess an extraordinary diversity of structures, architectures, and molecular weights, and this diversity strongly influences their physical, chemical, and mechanical properties. Because of this complexity, polymer scientists rely on a wide range of characterization techniques to gain insight into functional groups, morphology, thermal transitions, crystallinity, and mechanical behavior. While these techniques are powerful in their respective domains, many struggle to provide direct, quantitative information about molecular weight and molecular weight distribution. These two parameters are central to understanding polymer performance, processing behavior, and stability.
This analytical gap led to the development and adoption of Size Exclusion Chromatography (SEC), also referred to as Gel Permeation Chromatography (GPC) when performed in organic solvents. SEC has emerged as the gold standard for determining polymer molecular weight averages (Mn, Mw, Mz), polydispersity index (PDI), and the overall shape of the molecular weight distribution curve. Unlike techniques that infer chain size indirectly, SEC separates polymer chains explicitly on the basis of their hydrodynamic volume in solution, allowing researchers to visualize how chains of different sizes elute over time.
One of the most significant advantages of SEC is its solution-based, non-destructive nature. Samples do not undergo chemical reactions, thermal degradation, or harsh processing conditions during analysis. This makes SEC relatively inexpensive, highly repeatable, and ideal for routine quality control, polymer synthesis monitoring, degradation studies, and comparative analysis across research iterations. The method’s versatility has expanded further with the integration of advanced detectors—such as multi-angle light scattering, viscometry, and ultraviolet or refractive index detectors—which enable absolute molecular weight determination and deeper insight into polymer branching and conformation.
In this section, we will explore the fundamental principles that govern Size Exclusion Chromatography, examine why it has become essential for molecular weight analysis, and highlight how the technique is applied in modern polymer science through examples from current research. By understanding both the strengths and limitations of SEC, researchers can better interpret molecular weight data and make informed decisions in the design, synthesis, and application of polymeric materials.
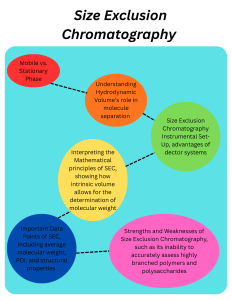
Figure 1: Graphical Abstract of the chapter, overviewing key aspects of Size Exclusion Chromatography discussed in this section
Section 1: Fundamentals of SEC
1.1 Principles of SEC
Size Exclusion Chromatography relies on the separation of molecules by size differentiation in order to analyze them. This is done through the use of a column. This column has 2 components, known as phases, that each play a role in the separation process. The Mobile Phase is the solvent used within the column to transport the injected sample. The selection of the mobile phase is crucial, as it must be a substance that has little to no chemical interaction with the selected sample. If chemical interactions occur, this runs the risk of diluting the sample within the column, skewing results. Thankfully, a wide variety of organic solvents and aqueous compounds, such as phosphate buffer, Tris buffer, methanol, and acetonitrile, exist that generally have low interaction with samples when carrying. The second aspect of our column is the Stationary Phase. This component is what performs the actual separation of the injected sample as it is transported through the column. In Size Exclusion Chromatography, the stationary phase is a set of porous beads packed within the column. These beads are typically made up of cross-linked polymers such as dextran, agarose, or polyacrylamide, due to their mechanical stability, high porosity, and overall hydrophilic nature. As the sample begins to travel through the column, smaller-sized molecules will interact with pores, slowing their travel compared to larger-sized molecules, leading to the separation.

Figure 2: Demonstration of the size separation principle seen in SEC. Large molecules (red) are too large to interact with the pores and thus travel the farthest. Medium molecules (green) have low interactions with the pores, slowing their elution. Small molecules (blue) heavily interact with the pores, leading to the slowest elution.
1.2 Hydrodynamic Volume
But what governs the interaction between polymer samples and the stationary phase within the column? This is where the principles of hydrodynamic volume become important. Hydrodynamic volume refers to the effective volume occupied by a polymer in a given solution. In the case of Size Exclusion Chromatography, a polymer’s hydrodynamic volume is determined by the solvent selected for the mobile phase, as well as its own individual characteristics such as total branching, crystallinity, and backbone conformation. This hydrodynamic volume will have a direct effect on the polymer sample’s retention time, which is a measure of the sample’s overall travel through the SEC column. A polymer that exhibits a large hydrodynamic volume will be unable to interact with the stationary phase as readily due to its size and travel further in the column, leading to a shorter retention time. In contrast, molecules with a smaller hydrodynamic volume will more easily diffuse into the pores, leading to a shorter elution and longer retention time. These hydrodynamic interactions are the key that allows the technique to properly separate and analyze a given polymer sample. As we will see later, however, the more complex a polymer system becomes, the more difficult it is to make molecular weight determinations purely based on this factor.
Section 2: SEC Setup and Data Analysis
2.1 Instrument Layout
Now that we know the scientific principles that which Size Exclusion Chromatography is built, we will focus on what data the technique can provide and how it does so. Figure 1 demonstrates a typical setup for an SEC system. Try to match the given answer with the area on the machine
Figure 3: Instrumental Set-up of a Size Exclusion Chromatography System. Detectors can include multi-angle light scattering, viscometry, and ultraviolet or refractive index sensors.
2.2 Detector Selection
When running an SEC analysis, a selected solvent will be pumped into the column along with the chosen sample. The column is hooked up to a detector, of which multiple different kinds can be selected based on one’s needs.
Typically, refractive index or ultraviolet systems are used as a basis for the detector. These detectors are useful in creating a conventional calibration standard and allow for the analysis of relative molecular weight and dispersity based on the calibration standards you created. Using only RI/UV systems by themselves presents a large issue in that the data they provide is relative, leading to inaccuracy, and cannot provide additional information on structural properties. To overcome this, additional detectors can be included within the system. Viscometers are typically added on with the RI/UV systems to obtain a universal calibration standard. The benefit of these standards is that they lead to more accurate data overall. Viscometers can also obtain structural information on your sample, such as intrinsic viscosity and hydrodynamic radius. To obtain an absolute molecular weight, which is independent of any calibration curve, you can incorporate a multi-angle light scattering detector (MALS) into your array as well. MALS work for molecular weight analysis since the intensity of light scattered by a molecule is directly proportional to its molecular weight. In other words, viscometer arrays are dependent on universal calibration, while MALS arrays are independent of it. However, MALS arrays require the dn/dc value of your standard and sample. Selecting your array is a question of your needs, equipment, and overall budget. Ideally, a multi-detector SEC should be used, as it provides the benefits of each detector discussed.
2.3 Mark–Houwink equation
Now that our setup is complete, we can look at the actual information provided by the detector of the SEC. Typically, for an SEC calibration curve, polystyrene standards are used. This is because polystyrene has a narrow molecular weight dispersion and high refractive index, which are crucial factors for obtaining accurate SEC data. When creating a universal calibration for SEC, we must rely on the Mark–Houwink equation, shown in Figure 2.
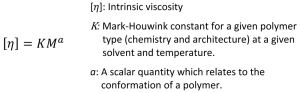
Figure 4: Mark–Houwink equation, where n is intrinsic viscosity, M is molecular weight, and K/a are constants specific to the polymer–solvent system and temperature.
Using this formula, we can create a direct relationship between the intrinsic viscosity and molecular weight of a sample by taking the log of both and plotting them. By doing this, we can estimate the molecular weight of an unknown sample as long as K and a are known constants.
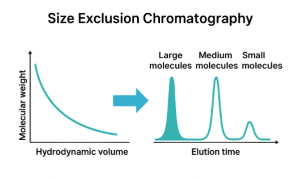
Figure 5: Diagram demonstrating the relationship between molecular weight, hydrodynamic volume, and elution time. Elution time is used to determine the hydrodynamic volume, which can be directly related to the molecular weight using the Mark–Houwink equation.
2.4 Data Points
Using this data and the mathematical relationships discussed, we can determine many key properties of a given polymer sample. Both the weight-average (Mw) and number-average (Mn) molecular weights can be obtained from SEC analysis, providing insight into the overall size and distribution of polymer chains. From these values, the polydispersity index (PDI) can be calculated, which reflects the uniformity of the polymer and gives information about the range of chain lengths present. By knowing the PDI, we can better understand other aspects of the polymer, such as weight distribution, potential degradation, or the presence of very short or very long chains. Beyond molecular weight, the type of detector used in SEC can reveal additional structural properties, including intrinsic viscosity, degree of branching, or differences in monomer composition between chains of different lengths. Furthermore, careful analysis of chromatograms can highlight potential experimental issues, such as poor solvent compatibility, aggregation, or thermal and UV-induced degradation, offering insight not only into the polymer itself but also into the quality and reliability of the analysis.
2.5 SEC Column Drag and Drop
Your professor has assigned you a task to see if you are able to understand SEC retention times. He has given you 3 polymers that will be run through the SEC column, along with a short description of said polymers. Based on the provided imagery and descriptions, determine where each polymer will theoretically end up within the column.
- Polyethylene Glycol (PEG): This polymer is highly flexible and often used to modify protein solubility. It tends to occupy a lot of space in solution
- Polystyrene (PS): A rigid, aromatic polymer commonly used in plastics. Its chains are moderately long and relatively stiff
- Polyvinyl Alcohol (PVA): A small, water-soluble polymer often found in films and adhesives. Its chains are short and simple compared to others.
Section 3: Peer-Reviewed Study
3.1 Overview
In the study “Size-exclusion chromatography (SEC) of branched polymers and polysaccharides”, researchers examined the behavior of highly branched synthetic polymers and structurally complex polysaccharides within SEC systems, with particular focus on how these materials challenge the foundational assumptions of the technique. SEC is designed to separate macromolecules based on hydrodynamic volume, and its accuracy relies on several key conditions: complete dissolution of the sample, minimal interaction or adsorption with the stationary phase, avoidance of shear-induced degradation, and the use of appropriate injection concentrations to prevent column overloading. While these criteria are generally manageable for linear polymers, branched polymers introduce substantial analytical complications. Their compact molecular conformations differ significantly from the extended coil structures of linear polymers used for calibration, causing branched chains to occupy a smaller hydrodynamic volume at a given molecular weight. Because SEC retention time reflects hydrodynamic volume rather than true mass, branched polymers elute later and therefore appear artificially small on chromatograms, leading to systematic underestimation of molecular weight.
This issue becomes even more pronounced with increasing degrees of branching, architectural complexity, and the inherent structural irregularity of many polysaccharides, which often possess varied branching patterns, aggregation tendencies, and broad dispersities. As a result, the study highlights not only the limitations of conventional calibration-based SEC but also the need for modern approaches, such as multi-detector SEC incorporating light scattering and viscometric analysis, to obtain reliable molecular weight and architectural information. These findings provide a critical foundation for understanding how SEC must be adapted when applied to branched and biologically derived polymer systems, offering important context for the broader discussion in this chapter on SEC principles, capabilities, and methodological considerations.
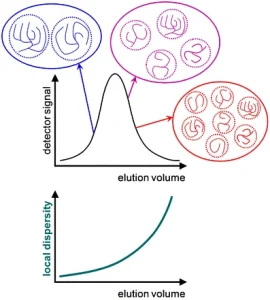
Figure 6: Schematic representation of three populations of branched polymers within a SEC chromatogram and the corresponding local dispersity
3.2 Importance of the Study
Throughout this section, we have discussed the strengths and advantages of SEC as an analytical technique for polymer characterization, particularly in determining molecular weight distributions and solution behavior. However, studies such as “Size-exclusion chromatography (SEC) of branched polymers and polysaccharides” demonstrate that SEC is not universally reliable for all polymer architectures and that its limitations must be carefully considered during data interpretation. Because SEC separation is governed by hydrodynamic volume rather than true molecular weight, the technique struggles when faced with polymers whose shapes, conformations, or topologies deviate significantly from the linear chain standards used for calibration. Highly branched polymers, hyperbranched structures, comb polymers, and naturally irregular polysaccharides do not conform to the assumptions underlying traditional SEC calibration curves, leading to distorted molecular weight estimates, inaccurate dispersity values, and misinterpretations of polymer architecture.
These challenges underscore a broader point relevant to this chapter: SEC is powerful, but only when applied with an understanding of its underlying assumptions and constraints. The study highlights that conventional, single-detector SEC cannot reliably evaluate complex, multi-dimensional polymer systems, which mirrors the general message of this chapter—that characterization techniques must be matched to the structural complexity of the material under study. As polymer science continues to advance toward increasingly intricate macromolecular chemistries, the need for more robust SEC methodologies becomes evident.
This is where detector diversity becomes essential. Incorporating additional detectors such as multi-angle light scattering (MALS), viscometric detection, or UV/RI combinations transforms SEC from a relative technique dependent on calibration curves into a multi-dimensional, absolute characterization tool. These detectors allow researchers to measure molecular weight directly, determine intrinsic viscosity, quantify branching factors, and assess chain conformation—information that cannot be obtained from retention time alone. In essence, multi-detector SEC overcomes the very limitations highlighted in the study by providing a more complete physicochemical description of branched and irregular polymers
Section 4: Conclusion
Size Exclusion Chromatography is a multifaceted technique that allows for the identification and research of molecular weight properties of a given polymer sample. SEC has many applications and benefits that make it the foremost technique for this type of analysis, including being non-destructive, having versatile detector capabilities that allow for enhanced, repeatable data collection, and working with a large number of polymer sample types. SEC’s usage of hydrodynamic volume as the basis for analysis provides a critical advantage in molecular weight and PDI determination, as it allows researchers to examine polymers under realistic solution conditions rather than relying on assumptions about their dry-state structure.
However, as seen in the study discussed, SEC is still nuanced in its application, with important limitations that must be addressed, such as polymer solubility, interactions with the stationary phase, and poor data collection on more complex polymer systems like branched polymers and polysaccharides. These structural complexities cause deviations from the calibration standards commonly used in SEC, leading to inaccurate molecular weight values if no corrective measures are applied. Fortunately, many of these limitations can be minimized through careful selection of detector arrays and the use of universal calibration standards, which improve accuracy by accounting for differences in polymer architecture and hydrodynamic behavior.
In conclusion, Size Exclusion Chromatography is an excellent analytical technique that offers many benefits in molecular weight determination, but it also has key limitations that must be considered and addressed before running an analysis. With appropriate detectors and thoughtful experimental design, SEC can provide highly reliable and insightful data even for challenging polymer systems.
References
- Gaborieau, M.; Castignolles, P. Size‑exclusion chromatography (SEC) of branched polymers and polysaccharides. Anal. Bioanal. Chem. 2011, 399(4), 1413–1423. DOI: 10.1007/s00216-010-4221-7, https://link-springer-com.prox.lib.ncsu.edu/article/10.1007/s00216-010-4221-7
- Malvern Panalytical. (n.d.). GPC/SEC detector combinations: what data is available with each? Retrieved from https://www.malvernpanalytical.com/en/learn/knowledge-center/insights/gpc-sec-detector-combinations-what-data-is-available-with-each
- Chemistry LibreTexts. (n.d.). 14.5: Size‑Exclusion Chromatography. In CHM 331 Advanced Analytical Chemistry. Retrieved from https://chem.libretexts.org/Courses/Providence_College/CHM_331_Advanced_Analytical_Chemistry_1/14%3A_Liquid_Chromatography/14.05%3A_Size-Exclusion_Chromatography
- Henderson, T. (2024, September 4). A laboratory guide to Size‑Exclusion Chromatography (SEC). ContractLaboratory.com. https://contractlaboratory.com/a-laboratory-guide-to-size-exclusion-chromatography-sec/
- ALWSCI. (2024, May 10). Mobile Phase Selection Guide: Optimal Solvent Pairing Strategies for Different Analytical Tasks. ALWSCI News. https://www.alwsci.com/news/mobile-phase-selection-guide-optimal-solvent-77320943.html
- Yang, H., Koza, S. M., & Yu, Y. Q. (2022). Determination of Hydrodynamic Radius With MaxPeak Premier Protein SEC Columns. Waters Corporation. Retrieved from https://www.waters.com/nextgen/us/en/library/application-notes/2022/determination-of-hydrodynamic-radius-with-maxpeak-premier-protein-sec-columns.html
- Modular Assembly of Hierarchically Structured Polymers – Scientific Figure on ResearchGate. Available from: https://www.researchgate.net/figure/Cartoon-illustration-of-the-size-exclusion-chromatography-system-consisting-of-a-solvent_fig10_320839273 [accessed 9 Dec 2025]
- Held, D., Preis, J., & Gores, F. (2015, December 1). Tips & Tricks GPC/SEC: Finding the Right Standards. LCGC International. https://www.chromatographyonline.com/view/tips‑tricks‑gpcsec‑finding‑right‑standards
- Held, D. (2018, April 16). Tips & Tricks GPC/SEC: How Do Calibration Curves Influence GPC/SEC Results? LCGC International. https://www.chromatographyonline.com/view/tips‑tricks‑gpcsec‑how‑do‑calibration‑curves‑influence‑gpcsec‑results‑0
- Netopilík, M., & Kratochvíl, P. (2003). Polystyrene‑equivalent molecular weight versus true molecular weight in size‑exclusion chromatography. Polymer, 44(12), 3431–3436. https://doi.org/10.1016/S0032-3861(03)00258-1