
25 Thermogravimetric Analysis (TGA) for Polymer Characterization: Thermal Stability and Composition
yli325
Learning Objectives
Chapter Learning Objectives:
1.Explain the basic working principle of thermogravimetric analysis (TGA) and the main parts of a TGA instrument.
2.Interpret simple TGA and DTG curves for polymers, including onset temperature, main degradation step, and residue.
3.Relate features in TGA curves to polymer thermal stability and degradation behavior.
4.Use TGA data to estimate moisture or volatile content and the filler (ash) content of a polymer sample.
5.Describe how atmosphere (nitrogen vs. air) and heating rate can change the TGA results.
Introduction :
Thermogravimetric analysis (TGA) is a thermal analysis technique that measures the change in mass of a polymer as it is heated under a controlled atmosphere. Because many important processes in polymers—such as moisture loss, evaporation of additives, and thermal degradation—are accompanied by measurable mass changes, TGA provides valuable information about thermal stability and material composition. By analyzing the TGA curve and its derivative (DTG), we can identify key events such as the onset of degradation, multiple decomposition steps, and the amount of inorganic residue or filler. TGA is also widely used to evaluate the thermal stability, composition, and degradation mechanisms of polymers and polymer-based composites.This chapter introduces the basic principles of TGA, explains how to interpret TGA and DTG curves, and demonstrates how this technique is used to characterize polymer materials.
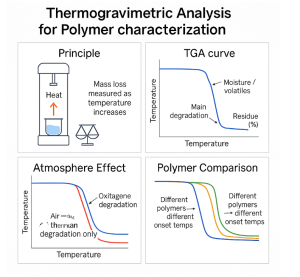
Principles:
Thermogravimetric analysis measures how the mass of a polymer sample changes as a function of temperature or time. During heating, polymers may lose absorbed moisture, release low-molecular-weight additives, decompose chemically, or leave behind inorganic residue. Because each of these events produces a distinct mass-loss pattern, TGA allows us to quantify these processes and understand the thermal behavior of the material. In simple terms, TGA provides a direct link between temperature and mass change, allowing researchers to understand when and how a polymer breaks down.
A typical TGA instrument consists of three main parts: a precision microbalance, a programmable furnace, and a controlled gas environment. The polymer sample is placed in a small, lightweight pan suspended from the balance, which continuously records mass with microgram sensitivity. The furnace heats the sample according to a selected temperature program, while the gas flow—usually nitrogen for inert conditions or air for oxidative conditions—ensures a consistent atmosphere throughout the experiment. Together, these components allow TGA to measure small and gradual mass changes accurately during heating.
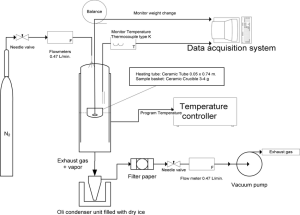 Figure1:Detailed TGA system schematic
During a TGA experiment, the instrument records the remaining mass of the polymer as the temperature increases, producing a curve known as the TGA curve. This curve typically shows one or more stages of mass loss, each corresponding to a physical or chemical process such as moisture evaporation, additive volatilization, or polymer degradation. To make these thermal events easier to distinguish, many instruments also generate a derivative curve called the DTG curve, which plots the rate of mass loss with respect to temperature. Peaks in the DTG curve indicate the temperatures at which mass loss occurs most rapidly and help identify overlapping degradation steps. Together, the TGA and DTG curves provide a detailed picture of how a polymer responds to heat and allow researchers to detect subtle thermal transitions that may not be visible in the TGA curve alone.
Because TGA continuously monitors mass as temperature increases, it provides a direct measurement of when thermal events occur and how much material is lost at each step. Unlike other thermal analysis methods that detect heat flow or dimensional change, TGA focuses specifically on mass changes, making it particularly useful for identifying degradation pathways, distinguishing components in multicomponent systems, and determining the amount of inorganic residue or filler in a polymer sample. With the principles of TGA established, the next section explains how to interpret the shapes and features of TGA and DTG curves to extract meaningful information about polymer stability and composition.
How to Read TGA and DTG Curves:
Thermogravimetric analysis produces a mass-versus-temperature curve that shows how a polymer loses weight during heating. A typical TGA curve is shown in Figure X. In nitrogen (solid line), the sample remains stable until around 300 °C, after which a rapid decrease in mass indicates the thermal decomposition of the polymer backbone. The mass eventually levels off, and the remaining residue represents inorganic fillers or char. Under air (dashed line), degradation begins earlier and proceeds more extensively because oxidative reactions accelerate chain scission. As a result, the final residue in air is noticeably lower than in nitrogen. This comparison demonstrates how atmosphere strongly influences the thermal stability and decomposition pathway of polymers.
To identify the exact temperatures at which mass loss occurs, the derivative TGA (DTG) curve is used (Figure X, right). The DTG curve plots the rate of mass change and displays one or more peaks corresponding to distinct degradation steps. The maximum of each peak (Tmax) represents the temperature at which the mass loss rate is highest. The DTG curve also reveals that the onset of degradation occurs earlier—around 175 °C in this example—than what is easily seen in the TGA curve. This makes DTG especially useful for detecting subtle early-stage degradation or distinguishing overlapping processes that produce only slight shoulder features in the TGA curve.
Together, the TGA and DTG curves provide complementary information. The TGA curve describes the overall mass loss behavior, including stability, major degradation steps, and final residue, while the DTG curve enhances sensitivity to the kinetics and number of decomposition events. When interpreted side by side, they allow researchers to compare materials, evaluate environmental effects such as oxidative conditions, and identify the thermal transitions most relevant to polymer processing and application.
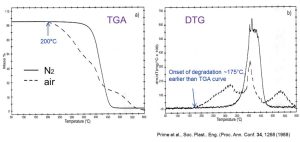
Figure 2 TGA and DTG curves of a polymer in nitrogen and air.
Experimental Parameters:
The results obtained from a TGA experiment depend strongly on the experimental conditions, particularly the atmosphere, heating rate, and sample size. One of the most important factors is the surrounding gas environment. As illustrated in Figure X, polymers degrade differently in nitrogen and air. In nitrogen, decomposition typically occurs through pyrolysis, leading to a single major mass-loss step and a larger residue. In contrast, heating in air promotes oxidative reactions that begin at lower temperatures and produce more extensive degradation. As a result, the onset temperature is lower and the final residue is smaller in air. Selecting the appropriate atmosphere is therefore essential for determining whether the goal is to measure intrinsic thermal stability or oxidative behavior.
Heating rate also has a strong influence on TGA curves. A faster heating rate shifts the degradation peak to higher temperatures because the polymer has less time to react at each temperature step. This can cause multiple degradation events to merge, making the DTG peaks broader and less distinct. A slower heating rate produces sharper peaks and better separation of overlapping degradation steps, which is useful for studying multi-component materials or materials with additives that decompose at close temperatures. However, slower heating rates increase experiment time. Researchers must therefore balance resolution and practicality when choosing a heating program.
Sample size and pan type further affect the measurement. Larger samples can create temperature gradients within the material, slowing heat transfer and delaying the apparent onset of degradation. Similarly, using heavier sample pans increases thermal inertia, which may shift the degradation temperature slightly. Standard practice is to use small sample masses—typically 5–10 mg—and lightweight pans to ensure rapid thermal equilibration and accurate mass measurement. By controlling atmosphere, heating rate, and sample geometry, TGA experiments can be tailored to provide reliable and meaningful information about polymer thermal behavior.
Applications:
Thermogravimetric analysis is widely used in polymer science because many important material properties and formulation details can be quantified directly from mass-loss behavior. One common application is determining moisture and volatile content. A small mass loss occurring below 150 °C usually corresponds to the evaporation of absorbed water or residual solvent. This information is helpful for assessing polymer drying processes, storage conditions, and the presence of low-molecular-weight additives. In some materials, a second small mass-loss step at moderate temperatures indicates the presence of plasticizers or unreacted monomers.
TGA is also an effective tool for evaluating thermal stability. The onset of major mass loss reflects the temperature at which polymer chains begin to degrade, while the DTG peak temperature indicates the maximum degradation rate. These parameters allow researchers to compare different polymer grades, assess the influence of processing conditions, and study the effects of oxidation, as illustrated by the difference between nitrogen and air atmospheres. Materials that retain mass at higher temperatures exhibit greater thermal stability and can often tolerate higher processing temperatures.
Another important application is estimating filler or ash content. After the polymer matrix has fully decomposed, the remaining mass corresponds to inorganic components such as glass fibers, metal oxides, or mineral fillers. Because TGA measures this residue directly, it is commonly used in quality control of composites, flame-retardant formulations, and fiber-reinforced plastics. The technique can also distinguish between polymers containing different amounts of additives, even when the initial materials appear visually similar.
Finally, TGA helps analyze multicomponent systems, such as polymer blends or composites. When different components decompose at different temperatures, the TGA and DTG curves show multiple steps or peaks. These features allow researchers to quantify the proportion of each component and to understand how one polymer influences the thermal behavior of another. In combination with atmosphere control and derivative analysis, TGA provides a powerful and flexible method for characterizing polymer composition and performance.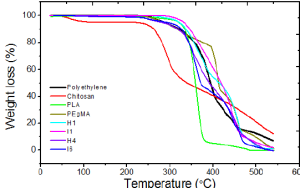
Figure 3:Application: Comparing materials
Related Paper Discussion:
Article:
Corcione, C. E. “Characterization of Nanocomposites by Thermal Analysis.” Materials 2012, 5(12), 2960–2980.
https://doi.org/10.3390/ma5122960
Research Overview:
The selected peer-reviewed paper, “Characterization of Nanocomposites by Thermal Analysis” by Corcione (2012), focuses on the use of thermal analysis techniques, especially thermogravimetric analysis (TGA), to characterize polymer-based nanocomposites. The main goal of this paper is to demonstrate how thermal analysis can be applied to evaluate the thermal stability, degradation behavior, and composition of polymers and polymer composites containing different fillers or nanomaterials.
In this study, TGA is used to monitor the mass change of polymer materials as a function of temperature under controlled heating conditions. By analyzing TG and DTG curves, the paper explains how different thermal events, such as moisture evaporation, polymer degradation, and filler decomposition, can be identified. The author emphasizes that the number of degradation steps, the onset degradation temperature, and the amount of residue remaining after heating provide important information about the material composition and thermal resistance.
The paper also highlights the importance of experimental parameters, including heating rate and atmosphere, in thermal analysis. These factors strongly influence the shape of TGA curves and the apparent thermal stability of polymer systems. Through examples of polymer nanocomposites, the study shows that the incorporation of fillers can improve or modify thermal stability, which can be clearly observed using TGA results.
Overall, this paper demonstrates that TGA is a powerful and widely applicable technique for polymer characterization, particularly for understanding thermal stability and material composition in complex polymer systems.
Relates to the paper:
The chapter “Thermogravimetric Analysis (TGA) for Polymer Characterization: Thermal Stability and Composition” provides a foundational explanation of the principles, experimental setup, and interpretation of TGA data for polymers. It introduces key concepts such as mass loss as a function of temperature, TG and DTG curves, and the use of controlled atmospheres to study polymer degradation behavior. These fundamental ideas are directly reflected and expanded upon in the selected peer-reviewed paper by Corcione (2012).
Specifically, the chapter explains how different mass-loss regions in a TGA curve can be associated with physical and chemical processes, including moisture evaporation, volatilization of additives, and polymer backbone degradation. The selected paper applies these same principles to polymer nanocomposites and demonstrates how the presence of fillers or nanoparticles alters these degradation steps. For example, changes in onset degradation temperature and residual mass are used in the paper to evaluate improvements in thermal stability and to estimate filler content, which directly supports the chapter’s discussion of using TGA for composition analysis.
In addition, the chapter emphasizes the influence of experimental parameters, such as heating rate and surrounding atmosphere, on the accuracy and interpretation of TGA results. This point is reinforced in the selected paper, where different thermal analysis conditions are discussed as critical factors affecting the shape and reliability of TG and DTG curves. The paper provides applied examples that illustrate why careful control of testing conditions, as described in the chapter, is necessary for meaningful polymer characterization.
Overall, the selected peer-reviewed paper serves as an applied extension of the chapter content. While the chapter introduces the theoretical background and general methodology of TGA for polymers, the paper demonstrates how these concepts are used in real research to evaluate thermal stability and composition in complex polymer systems, particularly polymer nanocomposites.
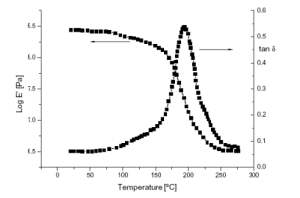
Figure 4. Typical dynamic mechanical thermal analysis (DMTA)spectrum of anUV-cured CE/0S1 (5 wt.%) nanocomposite.
Representative dynamic mechanical thermal analysis (DMTA) curves of polymer nanocomposites, showing the temperature dependence of storage modulus and relaxation behavior. The figure illustrates how the incorporation of nanofillers influences the thermomechanical response of polymer systems, including changes in modulus and transition regions. Such thermal analysis results complement TGA by providing additional insight into the effect of fillers on the thermal stability and structural behavior of polymer-based materials. (Adapted from Corcione, 2012)
Reference:
Xie, Q., Chen, D., & Ding, Y. (2022). Thermogravimetric analysis techniques and their applications in polymer characterization. Acta Polymerica Sinica, 53(2), 193–210. https://doi.org/10.11777/j.issn1000-3304.2021.21210
Corcione, C. E. “Characterization of Nanocomposites by Thermal Analysis.” Materials 2012, 5(12), 2960–2980.
https://doi.org/10.3390/ma5122960
Interactive video:
https://www.youtube.com/watch?v=PLcysdaC4lQ