As each functional group is discussed in future chapters, the spectroscopic properties of that group will be described. For the present, we’ll point out some distinguishing features of the hydrocarbon functional groups already studied and briefly preview some other common functional groups. We should also point out, however, that in addition to interpreting absorptions that are present in an IR spectrum, it’s also possible to get structural information by noticing which absorptions are not present. If the spectrum of a compound has no absorptions at 3300 and 2150 cm–1, the compound is not a terminal alkyne; if the spectrum has no absorption near 3400 cm–1, the compound is not an alcohol; and so on.
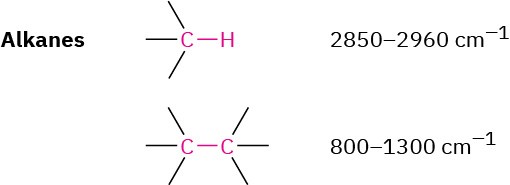
Alkanes
The IR spectrum of an alkane is fairly uninformative because no functional groups are present and all absorptions are due to C–H and C–C bonds. Alkane C–H bonds show a strong absorption from 2850 to 2960 cm–1, and saturated C–C bonds show a number of bands in the 800 to 1300 cm–1 range. Since most organic compounds contain saturated alkane-like portions, most organic compounds have these characteristic IR absorptions. The C–H and C–C bands are clearly visible in the three spectra shown previously in Figure 12.21.
Alkenes
Alkenes show several characteristic stretching absorptions. Vinylic =C–H bonds absorb from 3020 to 3100 cm–1, and alkene C═C bonds usually absorb near 1650 cm–1, although in some cases their peaks can be rather small and difficult to see clearly when the alkene is symmetric, or nearly so. Both absorptions are visible in the 1-hexene spectrum in Figure 12.21b.
Alkenes have characteristic =C–H out-of-plane bending absorptions in the 700 to 1000 cm–1 range, thereby allowing the substitution pattern on a double bond to be determined (Figure 12.23). For example, monosubstituted alkenes such as 1-hexene show strong characteristic bands at 910 and 990 cm–1, and 1,1-disubstituted alkenes (R2C═CH2) have an intense band at 890 cm–1.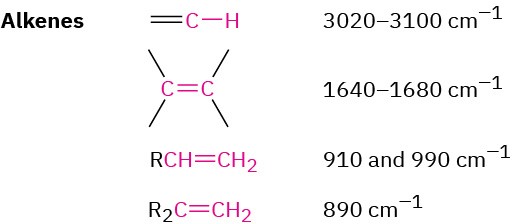
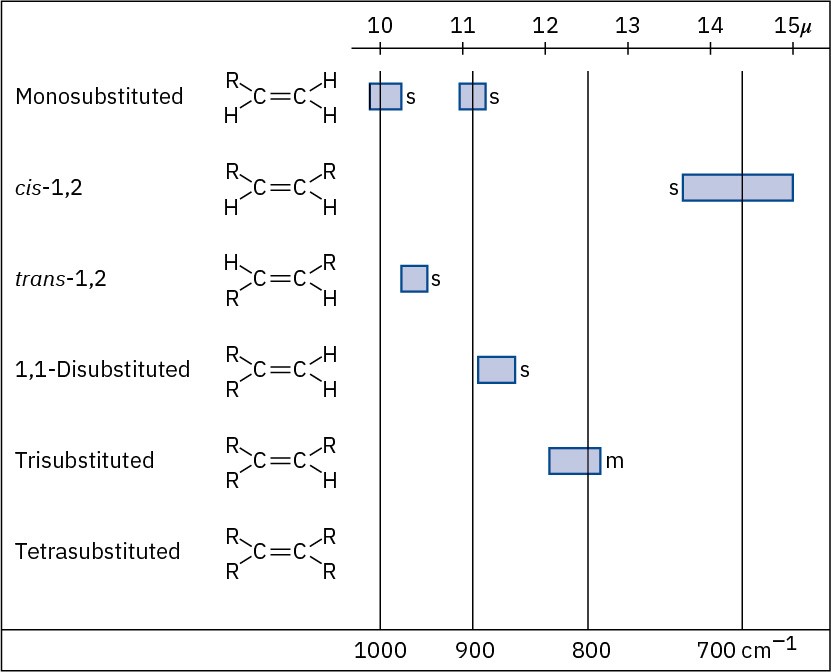
Figure 12.23 C–H out-of-plane bending vibrations for substituted alkenes.
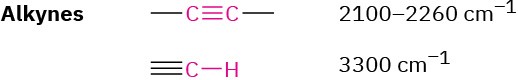
Alkynes
Alkynes show a C≡C stretching absorption at 2100 to 2260 cm–1, an absorption that is much more intense for terminal alkynes than for internal alkynes. Terminal alkynes such as 1-hexyne also have a characteristic ≡C–H stretching absorption at 3300 cm–1 (Figure 12.21c). This band is diagnostic for terminal alkynes because it is fairly intense and quite sharp.
Aromatic Compounds
Aromatic compounds, such as benzene, have a weak C–H stretching absorption at 3030 cm–1, just to the left of a typical saturated C–H band. In addition, they have a series of weak absorptions in the 1660 to 2000 cm–1 range and a series of medium-intensity absorptions in the 1450 to 1600 cm–1 region. These latter absorptions are due to complex molecular motions of the entire ring. The C–H out-of-plane bending region for benzene derivatives, between 650 to 1000 cm–1, gives valuable information about the ring’s substitution pattern, as it does for the substitution pattern of alkenes (Figure 12.24).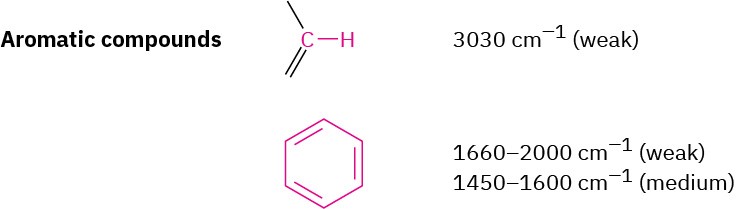
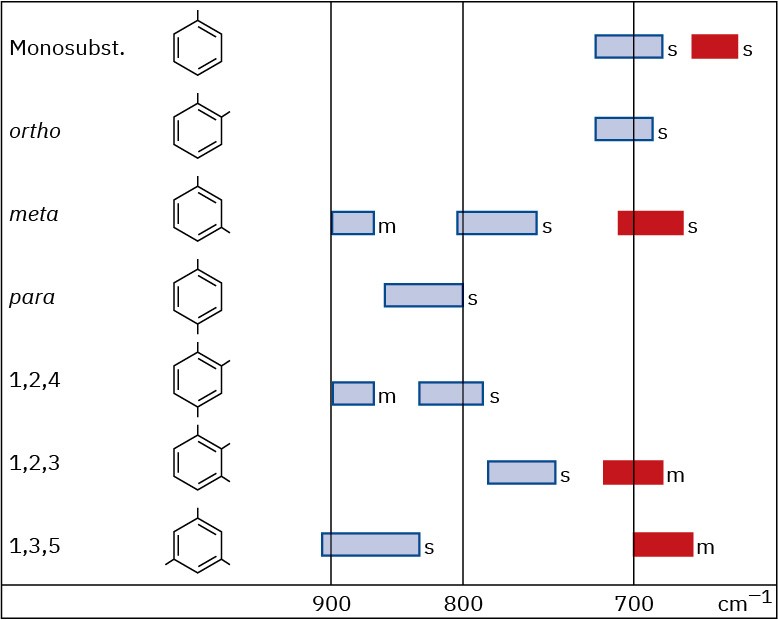
Figure 12.24 C–H out-of-plane bending vibrations for substituted benzenes.
The IR spectrum of phenylacetylene, shown in Figure 12.29 at the end of this section, gives an example, clearly showing the following absorbances: ≡C–H stretch at 3300 cm–1, C–H stretches from the benzene ring at 3000 to 3100 cm–1, C═C stretches of the benzene ring between 1450 and 1600 cm–1, and out-of-plane bending of the ring’s C–H groups, indicating monosubstitution at 750 cm–1.
Alcohols
The O–H functional group of alcohols is easy to spot. Alcohols have a characteristic band in the range 3400 to 3650 cm–1 that is usually broad and intense. Hydrogen bonding between O–H groups is responsible for making the absorbance so broad. If an O–H stretch is present, it’s hard to miss this band or to confuse it with anything else.
![]()
Cyclohexanol (Figure 12.25) is a good example.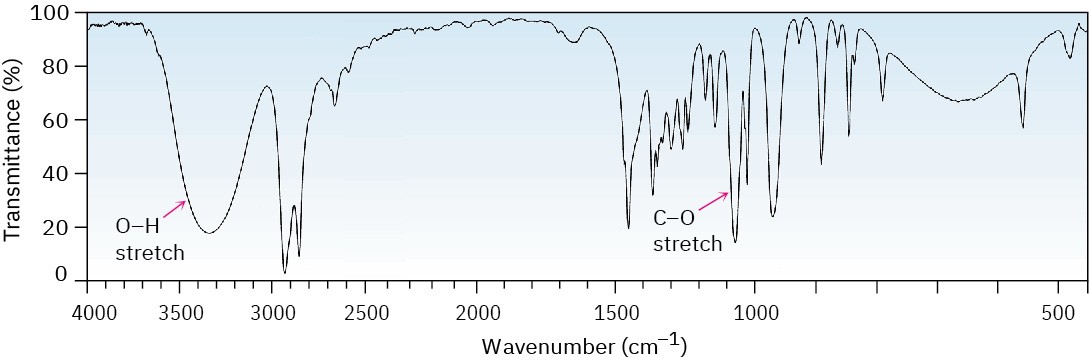
Figure 12.25 IR spectrum of cyclohexanol.
Amines
The N–H functional group of amines is also easy to spot in the IR, with a characteristic absorption in the 3300 to 3500 cm–1 range. Although alcohols absorb in the same range, an N–H absorption band is much sharper and less intense than an O–H band.
![]()
Primary amines (R–NH2) have two absorbances—one for the symmetric stretching mode and one for the asymmetric mode (Figure 12.26). Secondary amines (R2N–H) only have one N–H stretching absorbance in this region.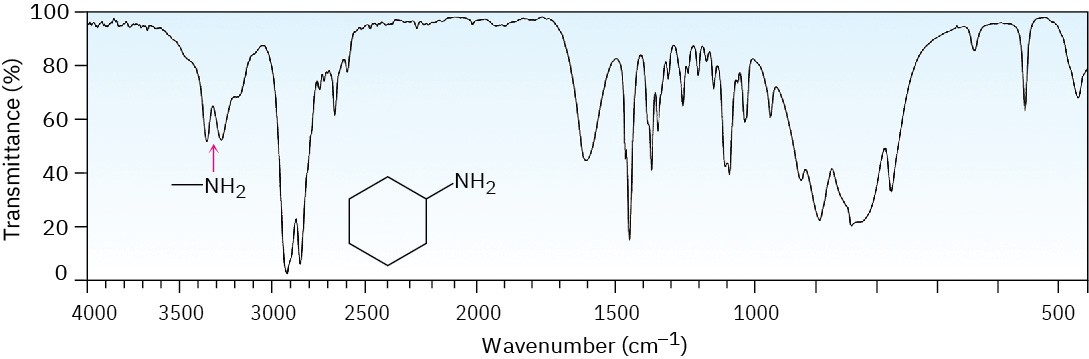
Figure 12.26 IR spectrum of cyclohexylamine.
Carbonyl Compounds
Carbonyl functional groups are the easiest to identify of all IR absorptions because of their sharp, intense peak in the range 1670 to 1780 cm–1. Most important, the exact position of absorption within this range can often be used to identify the exact kind of carbonyl functional group—aldehyde, ketone, ester, and so forth.
ALDEHYDES
Saturated aldehydes absorb at 1730 cm–1; aldehydes next to either a double bond or an aromatic ring absorb at 1705 cm–1.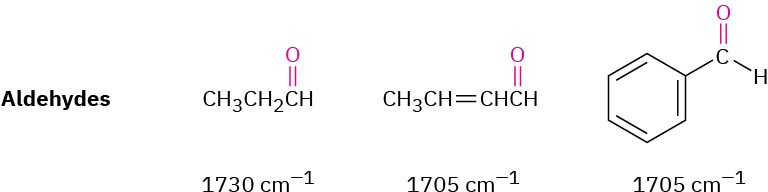
The C–H group attached to the carbonyl is responsible for the characteristic IR absorbance for aldehydes at 2750 and 2850 cm–1 (Figure 12.27). Although these are not very intense, the absorbance at 2750 cm–1 is helpful when trying to distinguish between an aldehyde and a ketone.
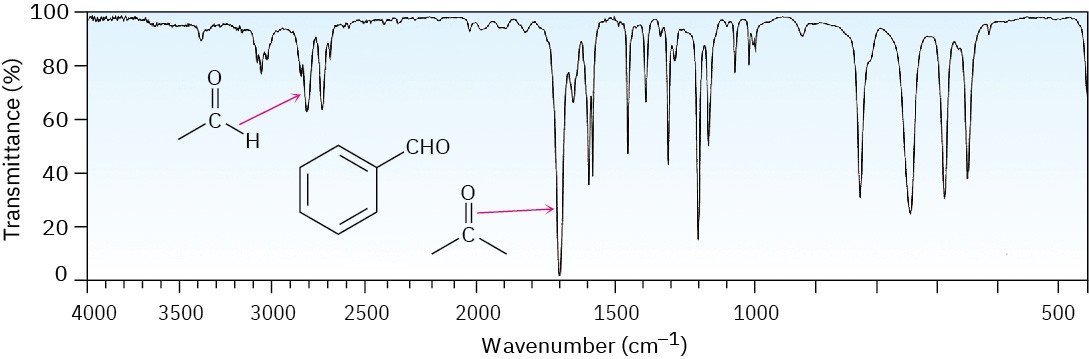
Figure 12.27 The IR spectrum of benzaldehyde.
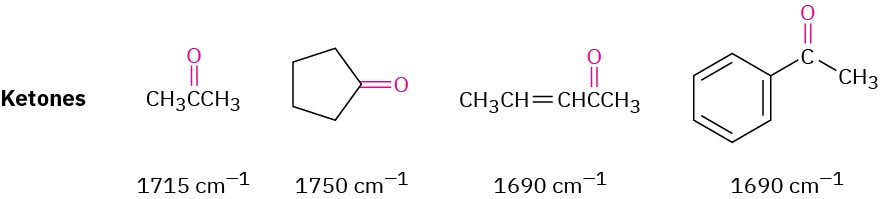
KETONES
Saturated open-chain ketones and six-membered cyclic ketones absorb at 1715 cm–1. Ring strain stiffens the C═O bond, making five-membered cyclic ketones absorb at 1750 cm–1 and four-membered cyclic ketones absorb at 1780 cm–1, about 20 to 30 cm–1 lower than the corresponding saturated ketone.
ESTERS
Saturated esters have a C═O absorbance at 1735 cm–1 and two strong absorbances in the 1300 to 1000 cm–1 range from the C–O portion of the functional group. Like other carbonyl functional groups, esters next to either an aromatic ring or a double bond absorb at 1715 cm–1, about 20 to 30 cm–1 lower than a saturated ester.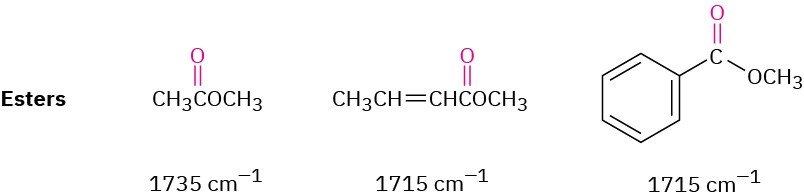
Worked Example 12.5 Predicting IR Absorptions of Compounds
Where might the following compounds have IR absorptions?
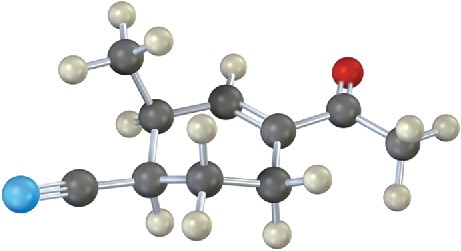
(a) 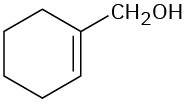 (b)
(b) 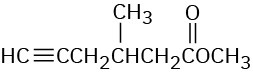
Strategy – Identify the functional groups in each molecule, and then check Table 12.1 to see where those groups absorb.
Solution
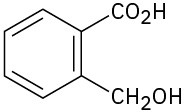
(a) Absorptions: 3400 to 3650 cm–1 (O–H), 3020 to 3100 cm–1 (=C–H), 1640 to 1680 cm–1 (C═C). This molecule has an alcohol O–H group and an alkene double bond.
(b) Absorptions: 3300 cm–1 (≡C–H), 2100 to 2260 cm–1 (C≡C), 1735 cm–1 (C═O). This molecule has a terminal alkyne triple bond and a saturated ester carbonyl group.
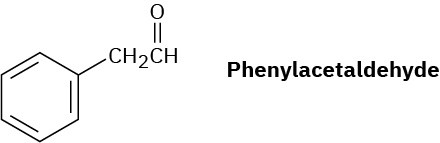
Worked Example 12.6 Identifying Functional Groups from an IR Spectrum
The IR spectrum of an unknown compound is shown in Figure 12.28. What functional groups does the compound contain?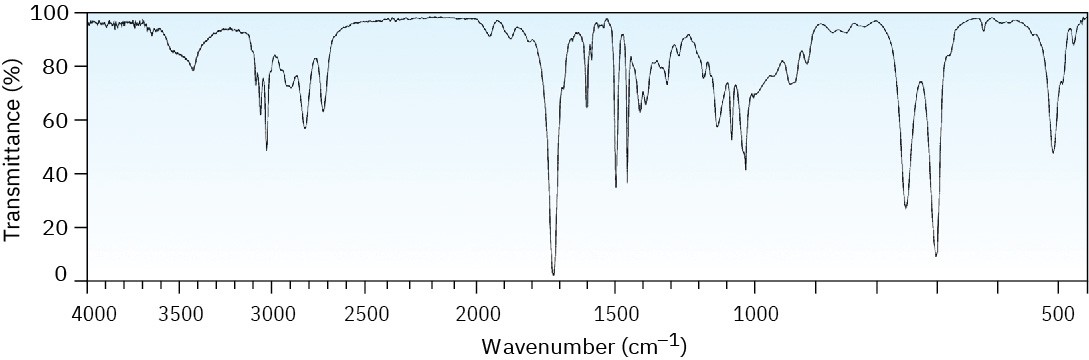
Figure 12.28 IR spectrum for Worked Example 12.6.
Strategy – All IR spectra have many absorptions, but those useful for identifying specific functional groups are usually found in the region from 1500 cm–1 to 3300 cm–1. Pay particular attention to the carbonyl region (1670 to 1780 cm–1), the aromatic region (1660 to 2000 cm–1), the triple-bond region (2000 to 2500 cm–1), and the C–H region (2500 to 3500 cm–1).
Solution – The spectrum shows an intense absorption at 1725 cm–1 due to a carbonyl group (perhaps an aldehyde, –CHO), a series of weak absorptions from 1800 to 2000 cm–1 characteristic of aromatic compounds, and a C–H absorption near 3030 cm–1, also characteristic of aromatic compounds. In fact, the compound is phenylacetaldehyde.
Problem 12-9
The IR spectrum of phenylacetylene is shown in Figure 12.29. What absorption bands can you identify?
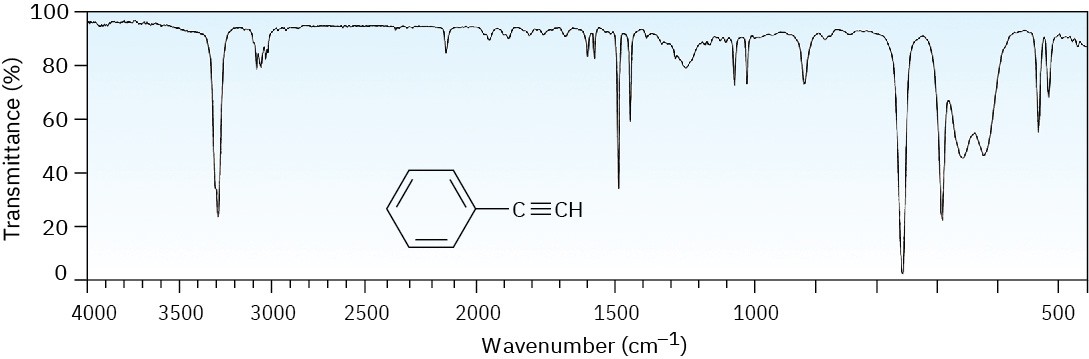
Figure 12.29 The IR spectrum of phenylacetylene, Problem 12-9.
Problem 12-10
Where might the following compounds have IR absorptions?
(a)
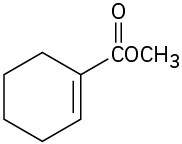
(b)
(c)
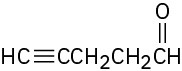
Problem 12-11
Where might the following compound have IR absorptions?