Infrared Spectroscopy
Ethers are difficult to identify by IR spectroscopy. Although they show an absorption due to C–O single-bond stretching in the range 1050 to 1150 cm–1, many other kinds of absorptions occur in the same range. Figure 18.3 shows the IR spectrum of diethyl ether and identifies the C–O stretch. Phenyl alkyl ethers show two strong absorbances for C–O stretching at 1050 and 1250 cm–1. Figure 18.4 shows the IR spectrum of anisole.
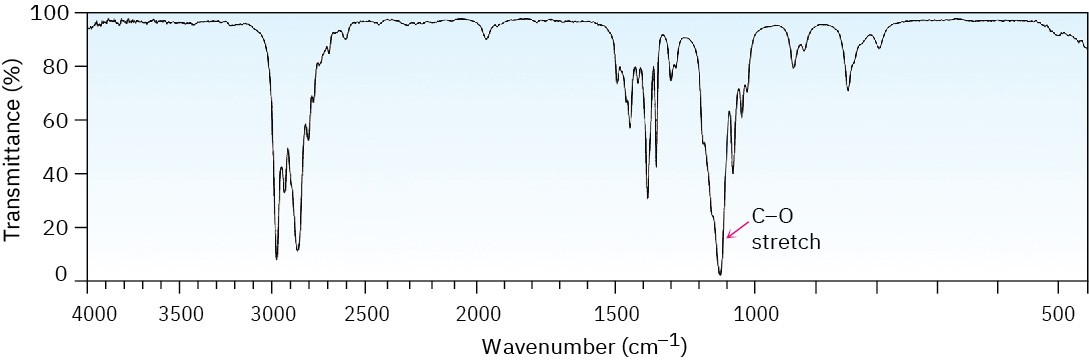
Figure 18.3 The infrared spectrum of diethyl ether, CH3CH2OCH2CH3.
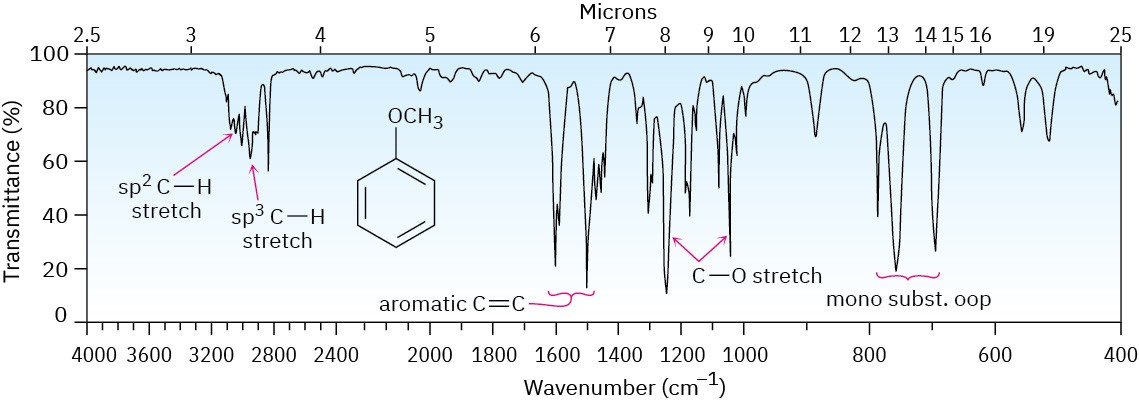
Figure 18.4 The infrared spectrum of anisole.
Nuclear Magnetic Resonance Spectroscopy
Hydrogens on carbon next to an ether oxygen are shifted downfield from the normal alkane resonance and show 1H NMR absorptions in the region 3.4 to 4.5 δ. This downfield shift is clearly seen in the spectrum of dipropyl ether shown in Figure 18.5.
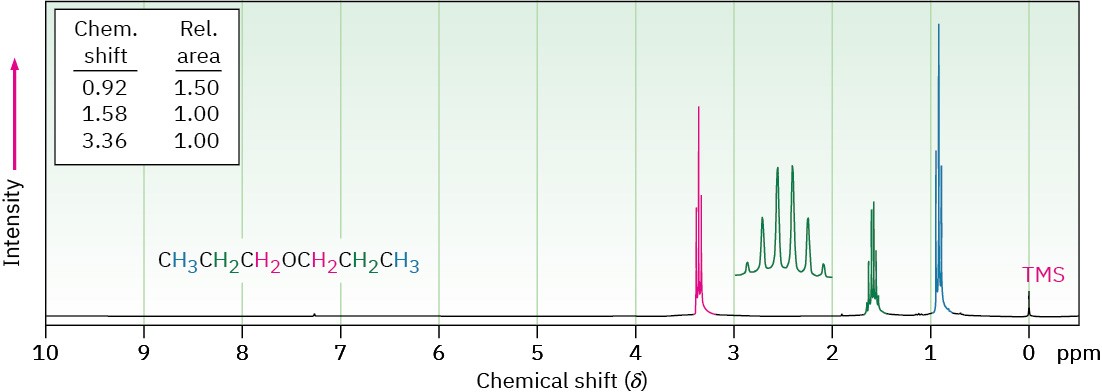
Figure 18.5 The 1H NMR spectrum of dipropyl ether. Protons on carbon next to oxygen are shifted downfield to 3.4 δ.
Epoxides absorb at a slightly higher field than other ethers and show characteristic resonances at 2.5 to 3.5 δ in their 1H NMR spectra, as indicated for 1,2-epoxypropane in Figure 18.6. The methylene protons of this epoxide are diastereotopic, and display complex splitting (see Section 13.7 and Section 13.8).
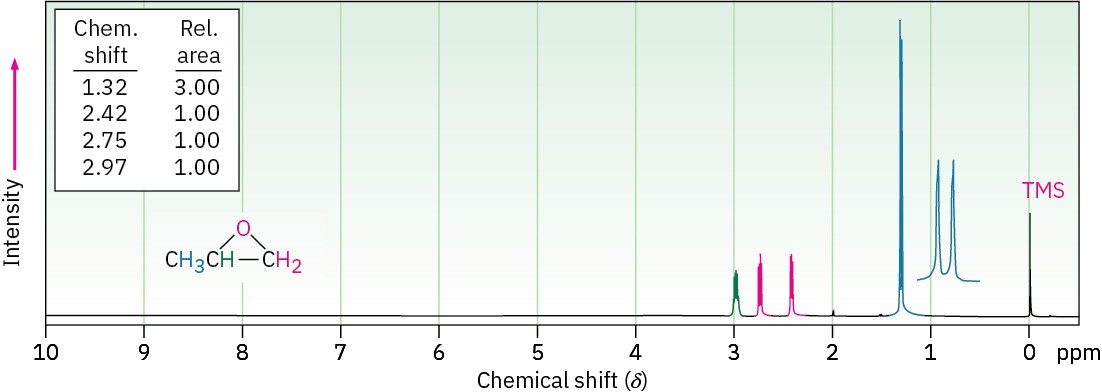
Figure 18.6 The 1H NMR spectrum of 1,2-epoxypropane.
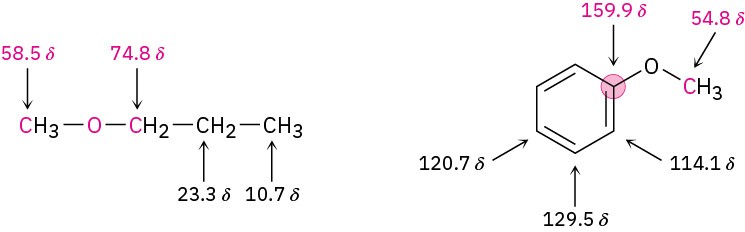
Ether carbon atoms also exhibit a downfield shift in the 13C NMR spectrum, where they usually absorb in the 50 to 80 δ range. For example, the carbon atoms next to oxygen in methyl propyl ether absorb at 58.5 and 74.8 δ. Similarly, the methyl carbon in anisole absorbs at 54.8 δ.
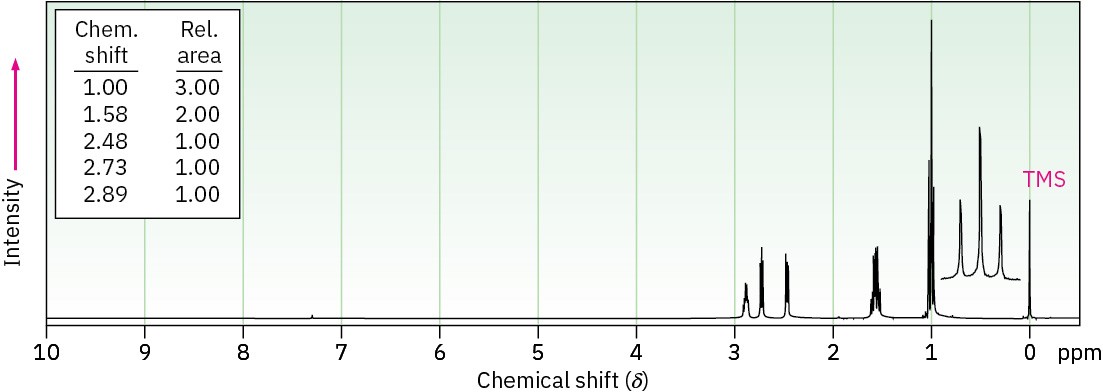
Problem 18-18
The 1H NMR spectrum shown is that of a cyclic ether with the formula C4H8O. Propose a structure.