6.2 The Bohr Model
Learning Objectives
By the end of this section, you will be able to:
- Describe the Bohr model of the hydrogen atom
- Use the Rydberg equation to calculate energies of light emitted or absorbed by hydrogen atoms
Following the work of Ernest Rutherford and his colleagues in the early twentieth century, the picture of atoms consisting of tiny dense nuclei surrounded by lighter and even tinier electrons continually moving about the nucleus was well established. This picture was called the planetary model, since it pictured the atom as a miniature “solar system” with the electrons orbiting the nucleus like planets orbiting the sun. The simplest atom is hydrogen, consisting of a single proton as the nucleus about which a single electron moves. The electrostatic force attracting the electron to the proton depends only on the distance between the two particles. This classical mechanics description of the atom is incomplete, however, since an electron moving in an elliptical orbit would be accelerating (by changing direction) and, according to classical electromagnetism, it should continuously emit electromagnetic radiation. This loss in orbital energy should result in the electron’s orbit getting continually smaller until it spirals into the nucleus, implying that atoms are inherently unstable.
In 1913, Niels Bohr attempted to resolve the atomic paradox by ignoring classical electromagnetism’s prediction that the orbiting electron in hydrogen would continuously emit light. Instead, Bohr assumed that the electron orbiting the nucleus would not normally emit any radiation (the stationary state hypothesis), but it would emit or absorb a photon if it moved to a different orbit.
Instead of allowing for continuous values of energy, Bohr assumed the energies of these electron orbits were quantized (i.e. only certain values were allowed):

From this, the energy change for the atom when an electron moves to a different orbit is:
![]()
or more simply:

In this equation, Ef and Ei are the energies of the final and initial orbits, respectively.
According to the law of conservation of energy, the energy of the photon absorbed or emitted would have the same magnitude but opposite sign (for the photon to gain energy, the atom must lose it, and vice versa) :
Ephoton = -ΔEatom


That is, the wavelength of the light emitted can only have certain values, which depend of the final and initial orbits for the electron transition.
The derived equation above matches the Rydberg equation shown at the end of the previous section. The match between Rydberg’s experimental results and Bohr’s theory meant that Bohr’s model was taken seriously, despite the many assumptions that Bohr needed to derive it.
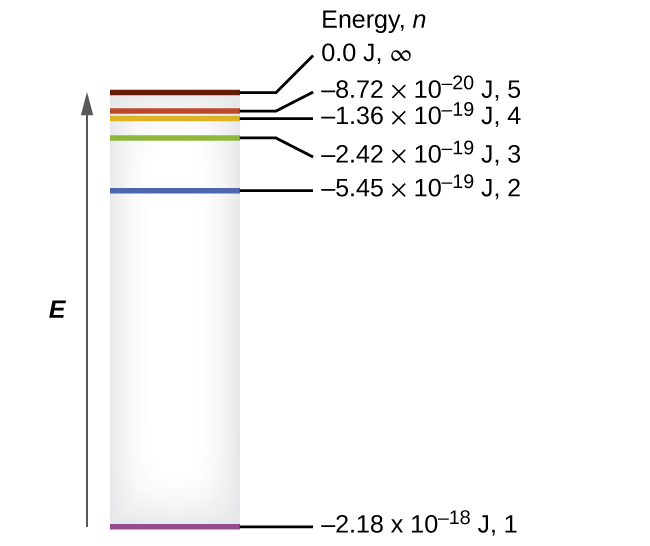
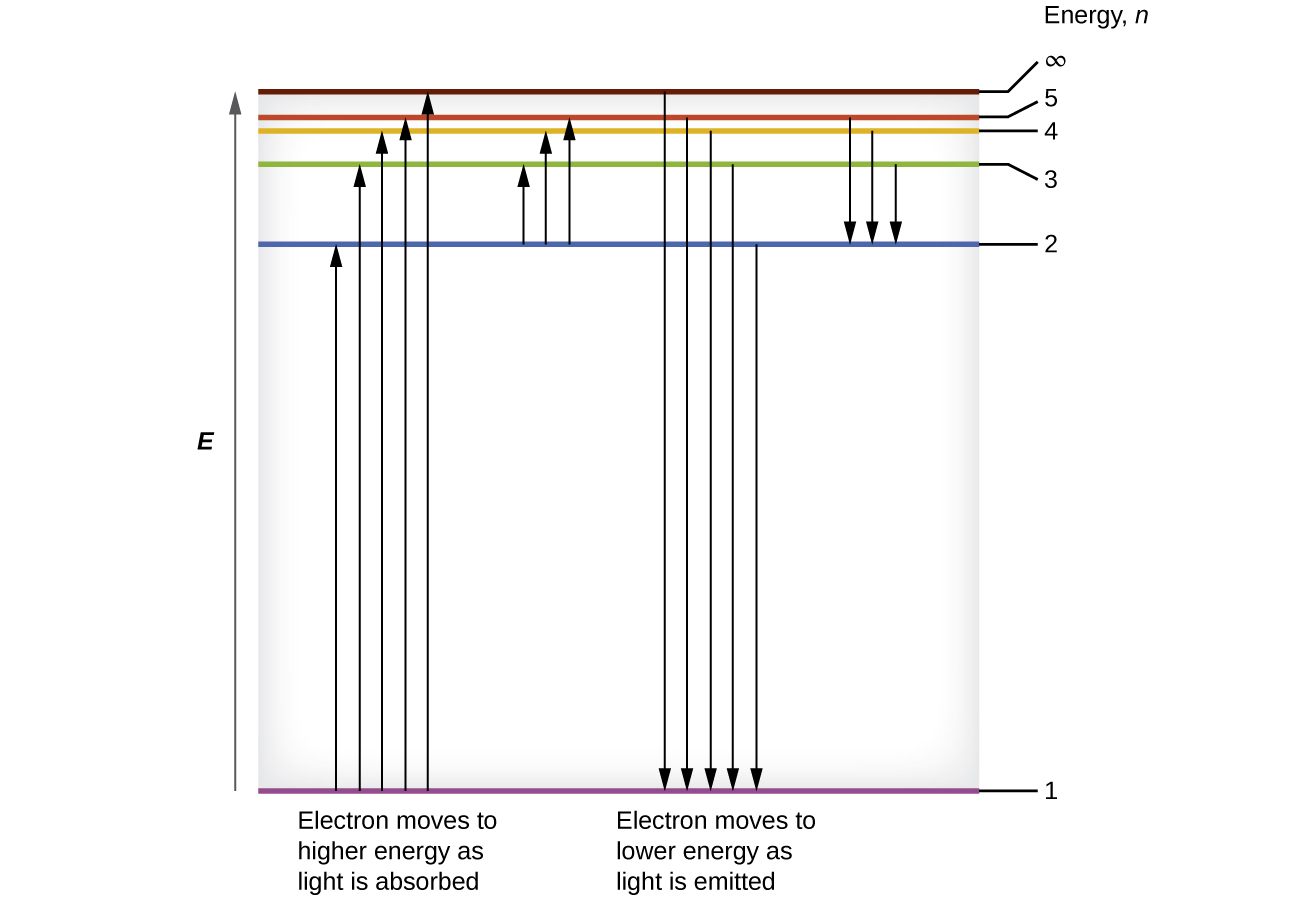
The energies of the lowest few energy orbits (or energy levels, for short) are shown in Figure 6.11. One of the fundamental laws of physics is that matter is most stable with the lowest possible energy. Thus, the electron in a hydrogen atom usually moves in the n = 1 orbit, the orbit in which it has the lowest energy. When the electron is in this lowest energy orbit, the atom is said to be in its ground electronic state (or simply ground state). If the atom receives energy from an outside source, it is possible for the electron to move to an orbit with a higher n value and the atom is now in an excited electronic state (or simply an excited state) with a higher energy. When an electron transitions from an excited state (higher energy orbit) to a less excited state, or ground state, the difference in energy is emitted as a photon. Similarly, if a photon is absorbed by an atom, the energy of the photon moves an electron from a lower energy orbit up to a more excited one. The law of conservation of energy says that we can neither create nor destroy energy. Thus, if a certain amount of external energy is required to excite an electron from one energy level to another, that same amount of energy will be liberated when the electron returns to its initial state (Figure 6.12).
As the electron’s energy increases (as n increases), the electron is found at greater distances from the nucleus. This is implied by the inverse dependence of electrostatic attraction on distance, since, as the electron moves away from the nucleus, the electrostatic attraction between it and the nucleus decreases and it is held less tightly in the atom. Note that as n gets larger and the orbits get larger, their energies get closer to zero, and so the limit n ⟶ ∞ implies that E = 0 corresponds to the ionization limit where the electron is completely removed from the nucleus. Thus, for hydrogen in the ground state n = 1, the ionization energy, or the energy required to remove the electron from the atom, would be:
It became clear to most physicists at that time that the classical theories that worked so well in the macroscopic world were fundamentally flawed and could not be extended down into the microscopic domain of atoms and molecules. Unfortunately, despite Bohr’s remarkable achievement in deriving a theoretical expression for the Rydberg constant, he was unable to extend his theory to the next simplest atom, He, which only has two electrons. Bohr’s model was severely flawed, since it was still based on the classical mechanics notion of precise orbits, a concept that was later found to be untenable in the microscopic domain, when a proper model of quantum mechanics was developed to supersede classical mechanics.

Example 6.3
Calculating the Energy of an Electron in a Bohr Orbit:
Early researchers were very excited when they were able to predict the energy of an electron at a particular distance from the nucleus in a hydrogen atom. If a spark promotes the electron in a hydrogen atom into an orbit with n = 3, what is the calculated energy, in joules, of the electron?
Solution:
The energy of the electron is given by this equation:

The electron is characterized by an n value of 3. Thus,
Check Your Learning:
The electron in Figure 6.12 is promoted even further to an orbit with n = 6. What is its new energy?
−6.053 × 10⁻²⁰ J

Example 6.4
Calculating the Energy and Wavelength of Electron Transitions in a Hydrogen Atom:
What is the energy (in joules) and the wavelength (in meters) of the line in the spectrum of hydrogen that represents the movement of an electron from Bohr orbit with n = 6 to the orbit with n = 4? In what part of the electromagnetic spectrum do we find this radiation?
Solution:
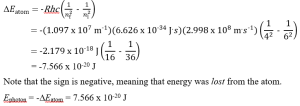
In this case, the electron starts out with n = 6, so ni = 6. It comes to rest in the n = 4 orbit, so nf = 4. The difference in energy between the two states is given by this expression:

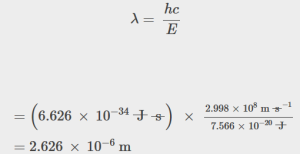
The wavelength of a photon with this energy is found by the expression ![]() .
.
Rearrangement gives:

From a picture of the electromagnetic spectrum, this wavelength is found in the infrared portion of the electromagnetic spectrum.
Bohr’s model of the hydrogen atom provides insight into the behavior of matter at the microscopic level, but it is does not account for electron–electron interactions in atoms with more than one electron. It does introduce several important features of all models used to describe the distribution of electrons in an atom. These features include the following:
- The energies of electrons (energy levels) in an atom are quantized, described by quantum numbers: integer numbers having only specific allowed value and used to characterize the arrangement of electrons in an atom.
- An electron’s energy increases with increasing distance from the nucleus.
- The discrete energies (lines) in the spectra of the elements result from quantized electronic energies.
Of these features, the most important is the postulate of quantized energy levels for an electron in an atom. As a consequence, the model laid the foundation for the quantum mechanical model of the atom. Bohr won a Nobel Prize in Physics for his contributions to our understanding of the structure of atoms and how that is related to line spectra emissions.
Key Concepts and Summary
Bohr incorporated quantization ideas into a model of the hydrogen atom that resolved the paradox of atom stability and discrete spectra. The Bohr model of the hydrogen atom explains the connection between the quantization of photons and the quantized emission from atoms. Bohr described the hydrogen atom in terms of an electron moving in a circular orbit about a nucleus. He postulated that the electron was restricted to certain orbits characterized by discrete energies. Transitions between these allowed orbits result in the absorption or emission of photons. When an electron moves from a higher-energy orbit to a more stable one, energy is emitted in the form of a photon. To move an electron from a stable orbit to a more excited one, a photon of energy must be absorbed. Using the Bohr model, we can calculate the energy of an electron in any one-electron system.
Key Equations
Glossary
- Bohr’s model of the hydrogen atom
- structural model in which an electron moves around the nucleus only in circular orbits, each with a specific allowed radius
- excited state
- state having an energy greater than the ground-state energy
- ground state
- state in which the electrons in an atom, ion, or molecule have the lowest energy possible

