
Chapter 7 – Primary Research & Customer Discovery
Learning Objectives
- Identify and describe the steps in a marketing research plan.
- Discuss the different types of data research.
- Review best practices for interviewing and survey design.
- Explain how data is analyzed.
- Identify the 7 elements of the marketing mix.
Market Research
Market research is essential during the planning phases of any start-up; otherwise, you’re shooting in the dark. On a basic level, market research is the collection and analysis of data related to a business’s target market. Market research can entail everything from information on competitors’ products to the interpretation of demographic data related to potential customers.
The main purpose of market research is to gain an understanding of customer needs and wants in an effort to reveal potential business opportunities. When you have a clear picture of what your target market is and what it wants, you can more effectively design your marketing mix to engage that demographic.
Imagine that you are creating a cosmetic line that is organic, contains vitamins and minerals, and is easy to apply. Your target market is women who are interested in high-quality beauty products that are not harmful to themselves or the environment. But after conducting extensive market research, you learn that women aged eighteen to forty-five years tend to be interested in the benefits your product line provides, but that women over fifty years of age are not. In light of these findings, you can either adjust your line’s benefits to serve the market you initially wanted to serve (all women), or you can cater to the needs of a smaller audience (eighteen to forty-five-year-old women).
A good exercise for better understanding your target market is to detail the everyday life of your ideal customer. You can do this by describing in detail a set of possible customers who would buy your product. Details could include demographic information such as gender, age, income, education, ethnicity, social class, location, and life cycle. Other information that would be helpful would include psychographics (activities, hobbies, interests, and lifestyles) as well as behavior (how often they use a product or how they feel about it). The better you know your ideal customer, the better you can focus on capturing their attention by matching their preferences with your offerings. Market research also helps you understand who your competitors are and how they serve the target market you want to engage. The more you know about your competition, the easier it will be to determine and differentiate your offerings. Let’s dive into how marketers gather all of this data and the value the data provides to entrepreneurs.
Primary Market Research
Primary research entails collecting new data for the purpose of answering a specific question or set of questions. While conducting your own research can be resource intense, it is also the best way to get answers specific to your business and products, especially if you want to penetrate niche markets that have not been studied. It also allows you to get specific. By asking the right questions, you can determine people’s feelings and attitudes toward your brand, whether they like your product design, whether they value its proposed benefits, and whether they think it is priced fairly. Figure 7.1 shows the steps common in conducting primary market research.
Step 1 – Define the Research Goal
You should start by defining the goal of your research project. What are you trying to find out? The more time you take to clarify your research questions, the more likely you will be to achieve your research goals.
Step 2 – Choose Research Design
The next step is to determine which research techniques will most effectively help you answer your questions. Considering what you want to learn and determining what your budget is will help you decide if qualitative or quantitative research best suits your needs. Well-designed research projects often use some combination of both.
Qualitative research uses open-ended techniques such as observation, focus groups, and interviews to gain an understanding of customers’ basic reasons, opinions, and motivations. It can be shared through words, descriptions, and open-ended comments. Qualitative data gives context but cannot be reduced to a statistic. One-on-one interviews are an excellent way for researchers to get more in-depth responses from research participants and allow the researcher to ask specific questions that match the respondent’s unique perspective as well as follow-up questions that piggyback on responses already completed. An interview allows the researcher to have a deeper understanding of the needs of the respondent, which is another strength of this type of data collection. The downside of personal interviews it that a discussion can be very time-consuming and results in only one respondent’s answers. Therefore, in order to get a large sample of respondents, the interview method may not be the most efficient method.
Quantitative research focuses on the generation of numerical data that can be turned into usable statistics. This kind of research most often takes the form of surveys or questionnaires that pose multiple-choice questions with predefined answers. Collecting primary data is commonly done through surveys due to their versatility. A survey allows the researcher to ask the same set of questions of a large group of respondents. Response rates of surveys are calculated by dividing the number of surveys completed by the total number attempted. Surveys are flexible and can collect a variety of quantitative and qualitative data. Questions can include simplified yes or no questions, select all that apply, questions that are on a scale, or a variety of open-ended types of questions. Electronic surveys are sent or collected through digital means and have the benefit of being less time intensive and is often a more economical way to gather and input responses than more manual methods.
Step 3 – Choose Sample
Your sample refers to who you will survey and how many people you will include. In most cases, you will want a sample that reflects your target market, the population who is most likely to purchase your product.
Step 4 – Collect Data
Depending on the type of research you conduct, your data collection methods will differ. In this course, students will complete interviews and surveys.
Interviews are a great method to secure open-ended answers. You might interview potential customers on what they think is the best way to communicate with them, what they like about certain competitors’ products, and get reactions to your product.
Read about interview best practices here.
Surveys can be done by hand or through online tools such as Survey Monkey or Qualtrics. Surveys are very helpful because you can ask questions to current or potential customers about your product, competitors’ products, customer service, and any other information you may seek to create or improve your business. They are an easy way to collect large amounts of data from many customers, and they allow you to calculate responses. Online tools are particularly useful in providing repositories of data that can be later exported to other analytical tools such as Excel or SPSS.
Read about survey design best practices here.
Step 5 – Analyze Data
Once you collect your data, the next step is to make sense of it. How you analyze the data depends largely on what you want to get out of it. Typically, you will be looking for patterns and trends among the answers. Data analysis is a field unto itself, and when complex analysis is required, seeking the assistance of experts is often worth the extra cost.
First, let’s discuss some basic statistics that can be used to represent data.
The first is the mean of quantitative data. A mean is often defined as the arithmetic average of values. The formula is:
Sum of Values / Number of Values = Mean
A common use of the mean calculation is with exam scores. Say, for example, you have earned the following scores on your marketing exams: 72, 85, 68, and 77. To find the mean, you would add up the four scores for a total of 302. Then, in order to generate a mean, that number needs to be divided by the number of exam scores included, which is 4. The mean would be 302 divided by 4, for a mean test score of 75.5. Understanding the mean can help to determine, with one number, the weight of a particular value.
Another commonly used statistic is median. The median is often referred to as the middle number. To generate a median, all the numeric answers are placed in order, and the middle number is the median. Median is a common statistic when identifying the income level of a specific geographic region. For instance, the median household income for Albuquerque, New Mexico, between 2015 and 2019 was $52,911. In this case, there are just as many people with an income above the amount as there are below.
Mode is another statistic that is used to represent data of all types, as it can be used with quantitative or qualitative data and represents the most frequent answer. Eye color, hair color, and vehicle color can all be presented with a mode statistic. Additionally, some researchers expand on the concept of mode and present the frequency of all responses, not just identifying the most common response. Data such as this can easily be presented in a frequency graph, such as the one in Figure 7.2.
Additionally, researchers use other analyses to represent the data rather than to present the entirety of each response. For example, maybe the relationship between two values is important to understand. In this case, the researcher may share the data as a cross tabulation (see Figure 7.3). Below is the same data as above regarding social media use cross tabulated with gender—as you can see, the data is more descriptive when you can distinguish between the gender identifiers and how much time is spent per day on social media.
Not all data can be presented in a graphical format due to the nature of the information. Sometimes with qualitative methods of data collection, the responses cannot be distilled into a simple statistic or graph. In that case, the use of quotations, otherwise known as verbatims, can be used. These are direct statements presented by the respondents. Often you will see a verbatim statement when reading a movie or book review. The critic’s statements are used in part or in whole to represent their feelings about the newly released item. It is the responsibility of the researcher to decide which presentation method will most accurately convey the research findings.
Step 6 – Results and Next Steps
At this stage, the entrepreneur seeks to reconcile the results of their research. For example, if you were doing exploratory research about a potential product you wanted to bring to market, now would be the time to ask questions such as whether the research suggests market potential.
Primary research, gathering original data through methods like interviews and surveys, provides fresh insights tailored to entrepreneurial questions. As valuable as these firsthand insights are, they’re most effective when combined with secondary research.
Marketing Mix
One of the biggest misconceptions people have about marketing is that it is all about promotion, or how a company sells or advertises something. But the truth is, promotion is just one facet of the marketing mix, which describes the basic set of strategies and approaches that marketers use to identify and reach their target market.
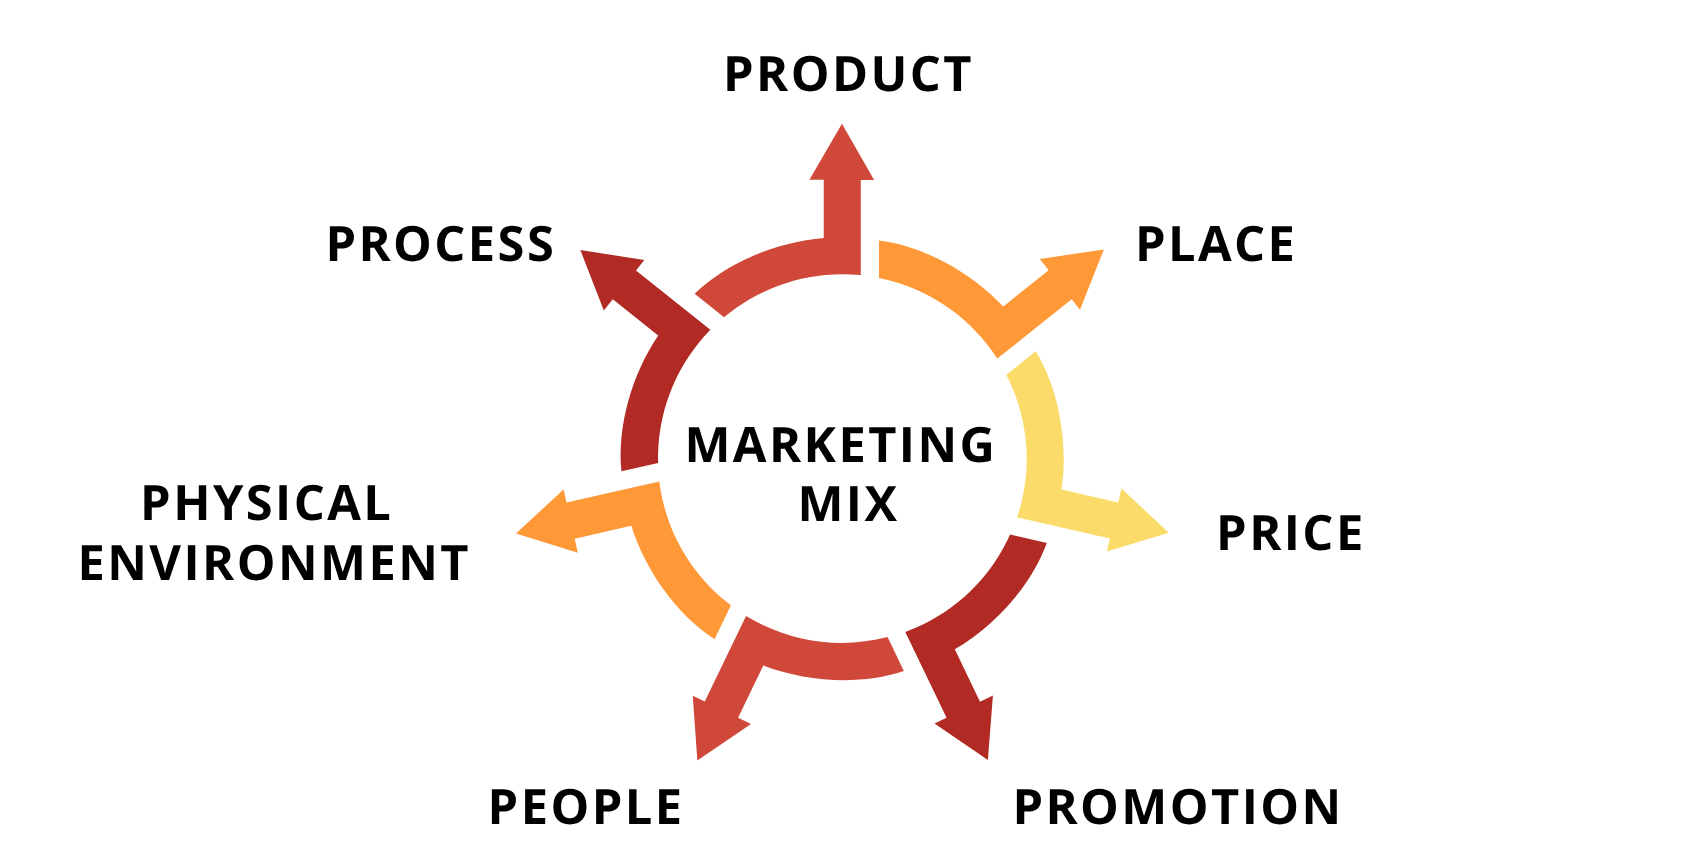
One common way of understanding and remembering the components of the marketing mix for products and services is by thinking in terms of the “7 Ps.” While each of these can be part of a company’s marketing mix, the first four relate more to products: product, pricing, promotion, and place (and traditionally have been called “the 4 Ps of marketing”). The remaining three relate more to services: physical environment, process, and people. While the 7 Ps are conceptually the same for all businesses, how a company addresses each “P” will be specific to that company’s needs and goals.
For a better understanding of the marketing mix, Figure 7.3 below breaks down the 7 Ps into their related activities.
Product
Within the marketing mix, product refers to a good or service that creates value by fulfilling a customer need or desire. Goods are tangible products that can be touched, smelled, heard, and seen, such as a pair of tennis shoes, a granola bar, or a bottle of shampoo. In contrast, services are intangible products. They usually entail paying an expert to do something for you, such as car repair or house cleaning.
Companies can bundle both goods and services together to create extra value for their customers. Birchbox, for example, provides goods (product samples) and services (customized product recommendations) to satisfy their customers’ desire to be able to buy beauty products in a hassle-free manner. The value Birchbox provides to customers relies on their ability to do both. In the United States, service-oriented businesses are increasingly playing a larger role in our local and national economies.
For start-ups, defining the value of the products they are going to offer is an important step toward identifying their competitive advantage within a marketplace. On a basic level, if you don’t know what benefit your product provides or what need it fulfills, neither will your customers. Kevin Plank, founder of Under Armour, knew that the value of his product would benefit many athletes who were tired of having to frequently change their wet sportswear. As a former football player, he had spent many hours training and enduring drenched practices, and wondered how he could alleviate this problem that companies didn’t address well with cotton sportswear. After college, he decided to take his idea to the next level and started a company making athletic wear that had special microfibers that kept athletes dry throughout practice and games. He then embarked on a trip to try to sell his value proposition to college football teams on the east coast. Nearing the end of 1996, he landed his first sale of shirts to Georgia Tech, which totaled $17,000—and the rest is history. Under Armour became a strong competitor to Nike and Adidas by providing a new type of athletic wear that has revolutionized performance by keeping athletes dry.
Promotion
Communicating a product’s benefits to customers is a significant aspect of any marketing mix. Even if a product is the best in its class, a company must communicate this value to customers, or it will fail. This is what promotion does: It is the process of communicating value to customers in a way that encourages them to purchase the good or service. Promotions must have a goal, a budget, a strategy, and an outcome to measure. Companies must use their promotional budget wisely to create the best results, which can include sales, profit, and awareness through the use of a cohesive message throughout the campaign.
Some typical forms of promotion are advertising, social media, public relations, direct mail, sales promotions, and personal selling.
Price
One of the most important and challenging elements of the marketing mix is pricing. Price is the value that must be exchanged for a customer to receive a product or service. This is usually monetary and has a direct impact on sales. Correctly pricing your product enables your company to be competitive while maximizing your product’s profit potential.
Here are a few popular pricing models to effectively price your product:
-
Subscription -The subscription model charges customers a monthly or annual fee to use its product, without regard to actual usage. One of the key benefits to this model is that the business obtains revenue up front; however, it is important for the business to monitor usage to prevent attrition. A popular example is a monthly subscription to Netflix.
-
Dynamic – The dynamic model is based on supply & demand and pricing fluctuates. Uber’s rates during busy times of the day will be higher than at less popular times.
-
Market-Based – The market-based model charges customers based on similar products. For example, imagine yourself in a grocery store’s laundry aisle and a variety of detergents are available. These products are priced within a certain acceptable range to consumers and differ only slight from their competitors.
-
Pay as you go – In contrast to the subscription model, pay as you go is based on usage. Your electricity bill is calculated based on the electricity you use each month. If you don’t use it, you aren’t charged.
-
Freemium – The freemium model offers a free version of the product and customers have the option to upgrade for a fee. Phone apps such as Duolingo offer free access with the option to upgrade to Super Duolingo with no ads and a more personalized experience.
Place
Place refers to the channels or locations—physical or digital—where customers can purchase your products; it is sometimes called distribution. For the entrepreneur, the choice of place lies in figuring out which channels will create the most profit. In other words, which channels will reach the majority of the target market at the most efficient cost. Choosing the right distribution channels is one way to create a competitive advantage and generate more success for your business. Certain channels have specific capabilities such as reaching more customers, providing promotions, and providing credit.
Direct channels, such as physical or online storefronts, require no intermediaries and allow you to sell directly to consumers. For example, if you own a bakery, you would likely have a retail storefront that sells directly to consumers.
Indirect channels require intermediaries such as distributors or sales agents to sell your products to the end customer or to other physical or online retail outlets. Indirect channels often have more than one intermediary. For example, to acquire more customers than you could reach on your own, your bakery would use indirect channels such as wholesalers or agents to get your products into local markets and grocery stores across the country. These companies would also help with logistics, which include transportation, warehousing, and handling of products.
People
People, or a company’s human resources, will always be a key factor in any successful business. In a service-oriented business, the people who interact with customers are especially important. Because the service is the product, they are the face of the brand and a direct link between the company and the customer.
When an employee delivers an acceptable or outstanding service, customers are encouraged to return to purchase the service again and also share their positive experience with others. When customers go into a jewelry store and receive good service from the salespeople, they will likely let their friends and family know about the positive experience through a personal referral or on social media.
When service is poor, customers don’t return. If customers have a bad experience at a restaurant, it is likely they will not patronize the establishment any longer and will probably share a negative review online. Sometimes, poor service has to do with factors other than employees, but as online review sites such as Yelp become more common, poor customer service reviews can have a devastating effect on a brand, especially for start-ups trying to break into a market. It is important to hire experienced people and have a good training system in place with rewards that will help employees deliver the best service to customers. Companies should take into consideration that no matter the size of a business, they must market not only to their customers but also to their employees, as they are the face of the company and the ones who interact with customers. Employees can make or break the brand.
Physical Environment
The physical environment where a service is provided is an important part of the marketing mix. It can influence the company’s image and convey a lot of information about the quality of a product, service, company, or brand. The old adage that you “get only one chance to make a first impression” is especially true for new businesses. Tangible cues—décor, smell, music, temperature, colors—send an immediate message to customers about quality and professionalism.
For example, if you walked into two dentists’ offices (remember, they are also entrepreneurs), and one office smelled and looked clean, and one did not, which one would you choose? The same goes for restaurants, retail stores, and any other physical environment. Since a service cannot be inspected before it is received, these cues help customers make their decisions.
Process
Process is the chain of procedures or activities required to provide a service to the customer. It is all of the activities that take place between the service provider and the customer, from beginning to end.
In the case of a doctor’s office, this would include making the appointment, filling out paperwork, waiting to be seen, seeing the doctor, and paying. Because processes can be long and involved, they need to be designed to flow as efficiently and logically as possible. In the case of services that are provided online, process includes the website’s design and functionality, and all of the steps customers take from browsing through check out. A strong website design helps the entrepreneur say what the company is about, what it does and for whom, and what actions the customer can take. Actions can range from clicking for more information, the ability to purchase a product, or checking whether there is availability for a service and being able to book it or make an appointment.
Project Focus
Which primary research method will you use for the project? Your research will give you the information you need to determine if your idea should become a recognizable opportunity.
Once your research is complete, you can finalize building blocks 1-5 on your Business Model Canvas.
Attribution
This work builds upon materials originally developed by OpenStax in their publication “Entrepreneurship,” which is licensed under CC BY 4.0.
