Chapter 3: Properties of Populations
Vocabulary
- Age structure: graphs showing the distribution of males and females of specific age ranges within a population
- Density Dependent Growth: the number of organisms in the population directly affects the growth rate
- Example: Resource allocation
- Density Independent Growth: the number of organisms in the population does not have an effect on the growth rate
- Example: Natural disasters
- Epidemiology: dispersal of pathogens
- Active vs. passive
- Genet: a group of genetically identical individuals, such as plants, fungi, or bacteria, that have grown in a given location and originated asexually from a single ancestor. (This is sometimes referred to as vegetative reproduction.)
- Metapopulation: local subpopulations, connected by movement of individuals
- Minimum Dynamic Area (MDA): area of suitable habitat necessary for maintaining the minimum viable population
- Minimum Viable Population (MVP): “smallest isolated population having a 99% chance of remaining extant for 1000 years despite the foreseeable effects of demographic and environmental stochasticity, and natural disasters”
- Population: a group of individuals of the same species, that inhabit a given area
- Population dynamics: patterns of continuous change over time
- Takes into account birth, death, and migration
- Ramet: an individual that does not contribute to the sexual diversity of a population.
Outline
Population Structure:
- Population: a group of individuals of the same species, that inhabit a given area
- Population structure includes features such as:
- Density
- Age
- Distribution
- Age Distribution/structure: the distribution of age groups across males and females in a given population, represented by age structure graphs
Population Dynamics:
- Population Dynamics: patterns of continuous change in a population over time
- Takes into account:
- Births
- Deaths
- Movement (immigration and emigration of individuals)
- Movement between populations is imperative to maintain a healthy gene pool and allow for population growth
- Takes into account:
- Population growth can be density-dependent or density-independent:
- Density Dependent Growth: the number of organisms in the population directly affects the growth rate
- typically affected by biotic factors such as disease, migration, food availability, predation, competition, etc.
- For example, populations may experience exponential growth when they are introduced to a new habitat with available resources / niche space. (This is especially true for invasive species.) In this example, the population’s growth is density dependent because it is regulated by available resources.
- Density Dependent Growth: the number of organisms in the population directly affects the growth rate
-
- Density Independent Growth: factors that occur regardless of the species’ population size
- For example, hurricanes and other natural disasters can decrease population size; but they are caused by weather or geological patterns that aren’t determined by how large or how small the population was before the event
- A population that is decimated by a natural disaster (e.g., hurricane, volcano eruption, wildfire) would likely not experience exponential growth, because the natural disaster would likely also decimate available resources. Furthermore, the species can’t change its life history strategies to increase reproductive rates in response to a natural disaster unless it recurs regularly.
- Density Independent Growth: factors that occur regardless of the species’ population size
- Genets are groups of genetically identical individuals (ramets) that have grown in a given location that have all originated vegetatively (asexually) from a single ancestor. Plants, fungi, and bacteria all produce genets via asexual reproduction.
- Ramets are the genetically identical individuals that make up a genet
- Do not contribute to the sexual diversity of a population
Population Distribution:
- Geographic range vs. population distribution:
- Geographic range: the area a population inhabits
- Niche requirements at different spatial scales
- Examples: worldwide, continental, region, physiographic area, cluster, locality, colony, or clump
- Population distribution: how individuals in a population are distributed in a given area
- Takes into account habitat suitability and geographic barriers
- Population density is crude
- Examples: random, uniform, clumped
- Geographic range: the area a population inhabits
- 3 different patterns of population distribution:
1. Random: no relationship (neutral interactions between individuals and the environment)
-
- Most common when movement is dictated by other factors
- Ex: wind dispersed seeds
- Most common when movement is dictated by other factors
2. Uniform: negative interaction (antagonistic relationship between individuals or local depletion of resources)
-
-
- Ex: Canopy trees competing for light in a forest
-
3. Clumped: occur in groups (attraction between individuals and/or to a common resource)
-
-
- Ex: Fish schooling to deter predation
-

Population Density:
- Crude density: includes all of the land within an organism’s range
- Can be improved by maintaining habitats and ensuring connectivity between habitats/populations
- Ecological density: includes only the portion of land that can actually be colonized by the species
- Ecological density = # individuals ÷ unit suitable habitat
- Accounts for patchiness
- Ecologists have to determine / classify what habitat is suitable based on the population’s needs. Then, they calculate the fraction of available habitat that is actually suitable.
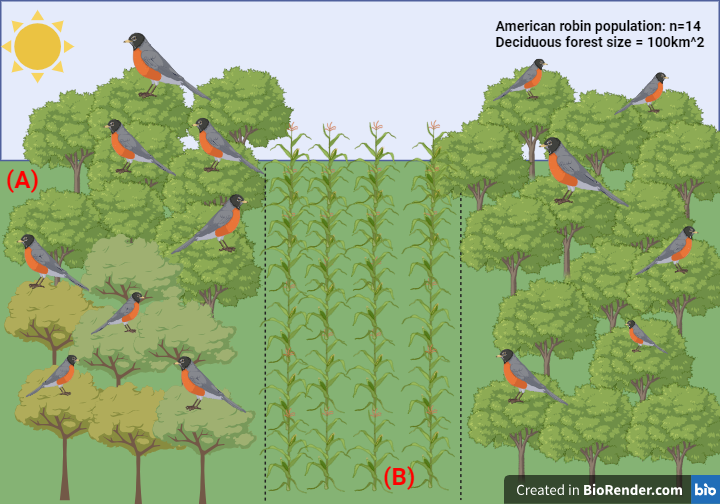
Figure 2. In this hypothetical example, a population of American robins (Turdus migratorius) live in 100 m2 of deciduous forest (A), which is considered suitable habitat because it satisfies the robin’s niche requirements (e.g., appropriate food and nesting sites). However, 30m2 of the forest have been cut down to grow row crops (B – outlined with dotted lines), which don’t support robins; this leaves only 70 m2 of forest available for the robins. Crude density = 14 robins divided by 100m2 of total habitat = 0.14 robins per m2. Crude density simply measures the number of individuals across the species’ entire range, which in this example is the entire forest. However, the ecological density = 14 robins divided by 70m2 of suitable habitat = 0.2 robins per m2. Ecological density takes into account the area of habitat that a species can actually utilize, which is why the area in the denominator was smaller – it only included the area of the two patches of forest. Figure credit: Riley Westman
- Estimating population abundance and density:
- Can be done by visually identifying animals of interest, listening for their calls, or identifying scat or footprints or through mark and recapture:
Calculating estimated Population Size:
N = nM / R
Where:
N = total number of individuals in population of interest
n = number of recaptured individuals that are marked
M = known # marked individuals
R = total number of individuals recaptured
Dispersal and Migration:
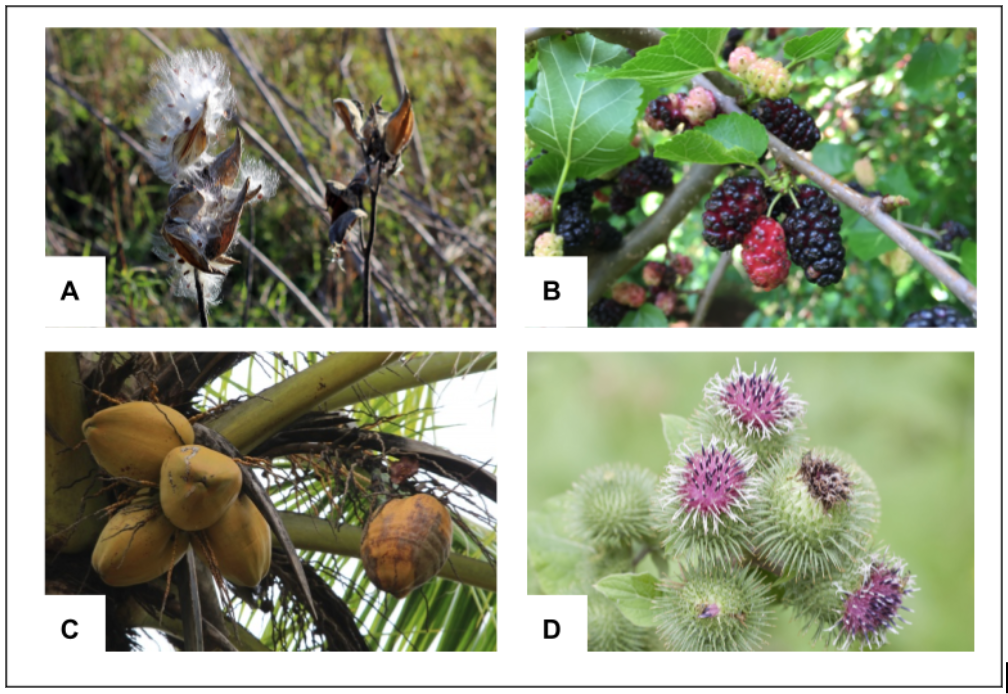
- Plants often produce seeds with traits that enable them to take advantage of a particular dispersal mechanism; these can include fruits to attract animals or structures that allow them to be picked up by wind or attach to animals.
- Modes of dispersal for seeds:
- Wind: random distribution
- Ex: Milkweed (A)
- Wind: random distribution
-
- Animal feces: clumped distribution
- Ex: Mulberries (B)
- Animal feces: clumped distribution
-
- Water: random and/or clumped distribution
- Ex: Coconuts (C)
- Water: random and/or clumped distribution
-
- Locomotive dispersal (attach to animal fur): clumped and/or random distribution
- Ex: Burdock (D)
- Locomotive dispersal (attach to animal fur): clumped and/or random distribution
- Dispersal vs. Migration:
- Dispersal: individuals permanently move away from where they were born and don’t return
- Migration: individuals (or a population) leave their original habitat for a certain amount of time and then return; can occur daily, seasonally, or over the course of multiple generations.

- Epidemiology: dispersal of pathogens may be
- Passive through inanimate agents (e.g., contaminated water sources)
- Active through infected individuals or vectors (e.g., mosquitos)
- Direct through contact with infected individuals
- Indirect by sharing food or water / beverage
Exponential Growth:
- Exponential growth can be expected when:
- A major disturbance event has occurred
- A species is introduced to a new region
- Example: Invasive plants experience exponential growth when first introduced into a new environment that meets their needs.
- Introduction phase (Early Detection Rapid Response)
- Colonization phase (Control)
- Naturalization phase (Restoration)
The Human Effect:
- Humans have a variety of effects, both beneficial and detrimental, to the populations of plants and animals. These effects can include:
- Decreased survivorship
- Organisms with long life histories may not live long enough to reproduce
- Increase survivorship
- If human activities (e.g., habitat fragmentation) favor species with short life histories (e.g., mice), then those short-lived species may experience population growth that leads to overcrowding.
- Decreased available habitat
- Species may be restricted to a smaller than necessary range, decreasing their available resources
- Smaller ranges can negatively affect the social behaviors of animals that hold territories, such as large carnivores.
- For example, individuals may become more aggressive and spend more time defending their territory (and less time foraging).
- Decreased survivorship

- How does territoriality affect population growth?
- Territorial species hold territories to control access to limited resources such as food, breeding grounds, and lookouts.
- Territoriality can increase population stability by maintaining a uniform distribution pattern
- Territorial species hold territories to control access to limited resources such as food, breeding grounds, and lookouts.
- Conservation Implications:
- Minimum Viable Population (MVP): the smallest isolated population that has a 99% chance of staying extant in the next 1000 years, despite the effects of demographic and environmental stochasticity and natural disasters.
- Some researchers might use predictive modeling to extrapolate from short-term population dynamics. Other research teams monitor populations of different sizes over many years / decades to document long-term stability.
- Minimum Dynamic Area (MDA): the area of suitable habitat necessary for maintaining the minimum viable population
- Minimum Viable Population (MVP): the smallest isolated population that has a 99% chance of staying extant in the next 1000 years, despite the effects of demographic and environmental stochasticity and natural disasters.
Questions from Students:
How is MVP calculated? I imagine that attempting to project population dynamics 1000 years in the future is incredibly difficult, if not impossible, so I am curious how we can report this number with any kind of certainty.
Answer: Great question! Some researchers might use predictive modeling to extrapolate from short-term population dynamics. Other research teams monitor populations of different sizes over many years / decades to document long-term stability.
Does Minimum Viable Population help determine if a Species Survival Plan is worth continuing for an endangered species?
Also, is this how we determine if a species is considered functionally extinct?
Answer: Great questions!
- MVP can inform the decision to remove a species from the SSP; but other factors are taken into account. For example, species with tremendous cultural importance (i.e., flagship species) may be kept on the SSP longer than might be considered necessary if we only took numbers into account, because they are so treasured. Conservation is incredibly value-laden!
- A species is considered functionally extinct when there are not enough individuals to perform that species’ ecological function.
Key Takeaways
Overarching Themes and Unifying Concepts:
- Populations are always shifting based on disturbances, resource availability, and interaction with other organisms.
- The study of populations includes their structure, dynamics, distribution, growth, movement, and interactions with other populations, organisms, and humans.
- Humans have large influences on the survivorship of populations (both positive and negative).
- Conservation of a species requires extensive knowledge of their population(s) structures and life histories.
- Scientific knowledge is ever-changing and current facts may one day be disproven, altered, or expanded upon.
- Research and education are key components of successful conservation.
How might this information be applied to address grand challenges?
- To improve conservation and management techniques, we must understand what contributes to population growth and dynamics, and how external and internal factors influence these.
Blog Style Summary
When you hear the word population what is the first thing that comes to mind? The number of people in your city? Or even just a group of people? In ecology, the word population is related to those meanings, but has a more concrete definition. A population is defined as a group of individuals of the same species that all inhabit a given area. Furthermore, all the individuals in a population have the biological potential to interbreed and produce offspring, as well as inhabiting the same area, which can vary in scale from a microhabitat to the entire globe. For example, humans can generally all interbreed with each other so they have the potential to be viewed as a population. The given area changes the population at a fundamental level. For instance, the population of humans across the globe is definitely different from the population of humans in the Democratic Republic of Congo, and similarly is different from the population of humans in your local CVS pharmacy. All three of those populations are similar in that they include humans, but what defines those populations – density, age, and distribution of humans – are very different across the three. An ecologist would call these factors that define a population the population structure.
A population structure is made up of characteristics that help better define a population. These characteristics are: the number of individuals in the population, the population density, or how many individuals inhabit a unit area, the population distribution, or how the individuals are arranged in the given area, and the age or sex of each individual. Each of these factors are helpful in learning more about a population. Population density is sometimes a fairly crude way of telling the density of a population because the population might be dispersed unevenly – for example, there could be a lot of land that is unusable to the population. We can adjust this crude density by calculating an ecological density that only takes into account the usable land for the population. This helps to account for the patchiness that we could sometimes see from a standard population density. This ecological density would take into account the variability of the actual habitat of the population. We can estimate population abundance, or the number of individuals in an area, with a mark and recapture technique. Scientists can mark individuals in an area, and then release them and recapture more of the population at a later time. The total number of individuals in that population can be estimated by multiplying the number of individuals marked with the number of individuals that were marked and recaptured. This number is then divided by the number recaptured to give an estimate of the population abundance.
N = nM / R
This video shows a quick example of mark-recapture technique used to estimate the number of foragers in a colony of ants.
Population dynamics are the patterns of continuous change, which can be separated into 4 categories: Births, Deaths, Emigration, and Immigration. Birth introduces new members to the population, which is essential for the population’s survival while death takes away members from a population whether it be old age or getting eaten by a predator. Emigration is when individuals of a population leave a given area for another area, which decreases the initial population while immigration is the opposite, where individuals join the population from another area. Movement, such as emigration and immigration, between populations plays a large role in population growth because it allows populations to maintain a healthy gene pool. Each of these 4 factors is important in determining the number of individuals within a population. We can compare and contrast the four population dynamics. For example, dispersal within a population is one way and only occurs once in an individual’s lifetime, whereas migration occurs in semi-regular intervals, and is usually a round trip.
Another factor to consider is how the population reproduces. If a population reproduces asexually it could be called a genet. A genet is a group of genetically identical individuals, and the individuals that make up the genet would be known as ramets. While ramets can be considered individuals, they do not contribute to the sexual diversity of a population because they all have the same genetic makeup. This makes these populations very susceptible to changes in the environment, as there is no genetic variation that would allow for adaptation. Geographic range and population distribution can often be confused with one another, but they have distinct differences. Geographic range is where the population inhabits, whether that be the tropical island of Hawaii or the freezing cold Antarctic. The geographic range can often tell you some information about the life history traits of a specific species, such as how adaptive they are to different environments. Population distribution however is how the specific members are distributed within a given area. There are 3 types of distribution:
random, uniformed, and clumped.
Random distribution is when there is no relationship between individuals and the environment. Random distribution is most common when movement is dictated by other factors, such as wind-carrying plant seeds. Uniform distribution is when there is a negative relationship between individuals. This can be due to a lack of resources or competition that is causing individuals to stay away from one another. An example of this could be tree canopies; individual trees have a uniform distribution to maximize the amount of sunlight they receive. Clumped distribution is when there is an attraction between individuals and/or a common resource. An example of this could be a common water source or the need to stay in a group, such as a school of fish.
Overall when looking at population dynamics we must consider the additional factors that play a role in population survival. Human effects include an increase or decrease in a population’s survivorship. A decrease in survivorship is common in species with long life histories, as they are not able to live long enough to reproduce. On the other hand, species with short life histories may experience overcrowding. Additional factors, such as decreased habitats, play a major role in species’ life histories.
Spotlight on NC
When considering any ecosystem, it is important to examine the populations of organisms that make up the system. Populations
are groups of organisms of the same species that live within a certain location. The way that individuals in a population are distributed can usually be described in one of three ways: randomly, uniformly, or clumped. Random distributions are where there is no pattern in the way that a species is found in an area. Populations that have a uniform distribution have individuals found in equal proportions throughout a given range. Finally, there are clumped distributions, where individuals of a species tend to be clustered in areas that have the resources that meet their needs. This last type of distribution is the most common, as resources typically are not found in the same quantities and proportions throughout a geographic region. Because of this, some populations can sometimes be divided into metapopulations that connect with each other via dispersal routes [1].

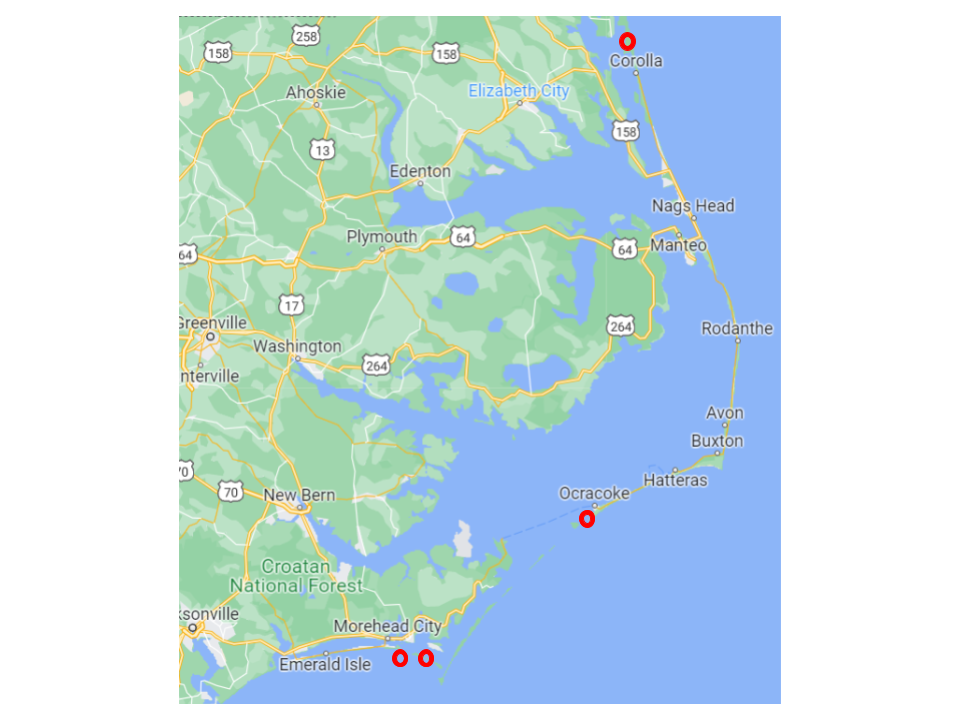
There are innumerable cases of different types of population distributions across the state of North Carolina, and the wild horses are a prime example. Wild horses have lived on North Carolina’s barrier islands for around five hundred years, descending from Spanish mustangs brought by early explorers. They once occupied most of the island chain, but starting in the early 1900s the National Park Service took over a majority of the islands and moved most of the horses onto more remote, isolated islands [2]. Today, the NPS protects the horses, but there are only four populations of wild horses left on the islands, each with a clustered population distribution (Figure 6). They roam together in herds, which can be found on the Rachel Carson Nature Preserve, Ocracoke Island, Shackleford Banks, and the Currituck Banks (see figure 6) [2]. However, these herds don’t make up a metapopulation, as a metapopulation is multiple subpopulations
that interact with each other. The four remaining herds never come into contact with each other because they’re separated by the ocean.
Another wildlife species that has interesting population dynamics is the Virginia big-eared bat (Corynorhinus townsendii virginianus), a subspecies of the Townsend’s big-eared bat. This bat has a small geographic range in western North Carolina; it is only found near Grandfather Mountain and Beech Mountain [3]. Much of the population mates and hibernates in a cave on Grandfather Mountain every winter, and in late spring females move to a nursery colony on Beech Mountain to give birth to just one pup [3]. Virginia big-eared bats stay clustered together in a clumped distribution because of a lack of suitable habitat in North Carolina and also to ensure warmth and security while hibernating [3].
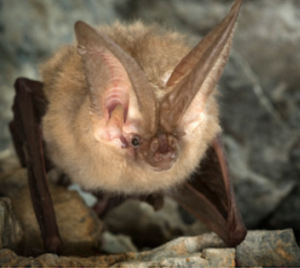
These bats are highly sensitive to human disturbance. A decrease in available habitat from deforestation and development has negatively impacted the survival of the species, most likely because they are carnivores and endemic to specific western regions in North Carolina [3]. Virginia big-eared bats roost in places with wide, open ceilings, rather than in crevices or cavities [3]. Roosting sites are highly vulnerable to light and sound since bats are nocturnal [4]. This species is not migratory; however, when roosting sites are disturbed, the bat colony may have to leave and change roosting sites, risking their health and survival as a result [4].
How to Apply Ecology in a Changing World
The challenge of estimating population size has become increasingly relevant within the last several decades. Humans are becoming more aware of our anthropogenic impact on populations. Climate change and habitat destruction have threatened and changed the distributions of populations around the globe, historically for the worse. These two variables make endemic species more vulnerable to becoming endangered or even going extinct [1]. Thus, there is a need to more accurately quantify the abundance of individuals within a population to identify which species are most threatened. This process is difficult, however, as populations are dynamic. The number of individuals within a population is continuously changing due to births and deaths, as well as movement due to immigration and emigration. Sampling becomes even more challenging when the species is relatively rare [2].
Developing accurate estimates of population size is crucial to forming governmental policies. Agencies such as the U.S. Fish & Wildlife Service have the power to create legislation to protect more vulnerable populations [3]. However, without concrete population numbers to back up these claims, it would be difficult to pass any legislation. Having accurate estimations helps our governmental systems do their job most effectively. Additionally, estimating population size assists with identifying the impact of invasive species. If left completely unchecked, invasives can overrun habitats and disrupt entire food webs [4].
One of the most common methods used to estimate population size is mark and recapture, a system where a relatively small number of individuals are caught, marked, and released (Figure 9). At a later date, a similar number of individuals in the same population are captured and the number of marked individuals that were caught is used to estimate the overall population [5]. Mark and recapture is frequently used because it allows us to estimate a population without having to actually count or mark every individual within the population, which is nearly impossible in most cases. Additionally, this method can be adapted to limit the interaction we have with sensitive species. In a study done by Manning and Goldberg, an accurate population estimate was calculated by recording point-coordinate locations of the nests of burrowing owls and monitoring the distance that the owls moved [6]. They found that the owls rarely left their nesting areas during breeding season, so by marking the coordinates of the nests the population could be estimated without disturbing the animals.

Other methods of population estimation include camera trapping and distance sampling. Camera trapping is exceedingly common in studies where the capture and observation of a certain species is nonviable, such as nocturnal animals. Distance sampling is also used when trying to avoid interaction with a species and is a method that uses the distance between an observer and an individual to calculate the proportion of animals in the area.
As mentioned before, mark and recapture methods are effective in helping us estimate population abundance. Getting an accurate estimate of how many individuals are in a certain geographic range can help ecologists in many ways. According to a review by Royle et al., population ecology is not studied as frequently as ecology on the individual level [7]. Population ecology is very important to understanding various species and how they are distributed within a given area, as well as the biotic and abiotic factors that affect them. Having a better understanding of population abundance in a given area is crucial to scientists’ efforts to ensure that populations have enough area to live a healthy life. If populations have the space they need to survive and reproduce it can help them fight against density-dependent factors such as increased competition for resources, food availability, and disease spread. If individuals in a population have a larger area to inhabit, there will most likely be more sources of food and other resources to support more individuals. This would in turn decrease the competition for these resources. Having a larger habitat can also decrease the spread of diseases and parasites, as it would decrease the potential contact between individuals that would allow for the pathogen to spread [8]. Lessening the negative effects these factors have on a population can allow for increased survivorship and reproduction and ultimately help a population, especially an endangered one, grow larger and healthier. Better understanding population abundance can help improve conservation efforts for specific populations or species. Having a better idea of the space or specific resources a population needs to survive can help scientists improve current conservation efforts for some endangered species, by helping tailor our conservation efforts to better fit the needs of specific populations.
Featured Ecologists
Rashidah H. Farid, PhD
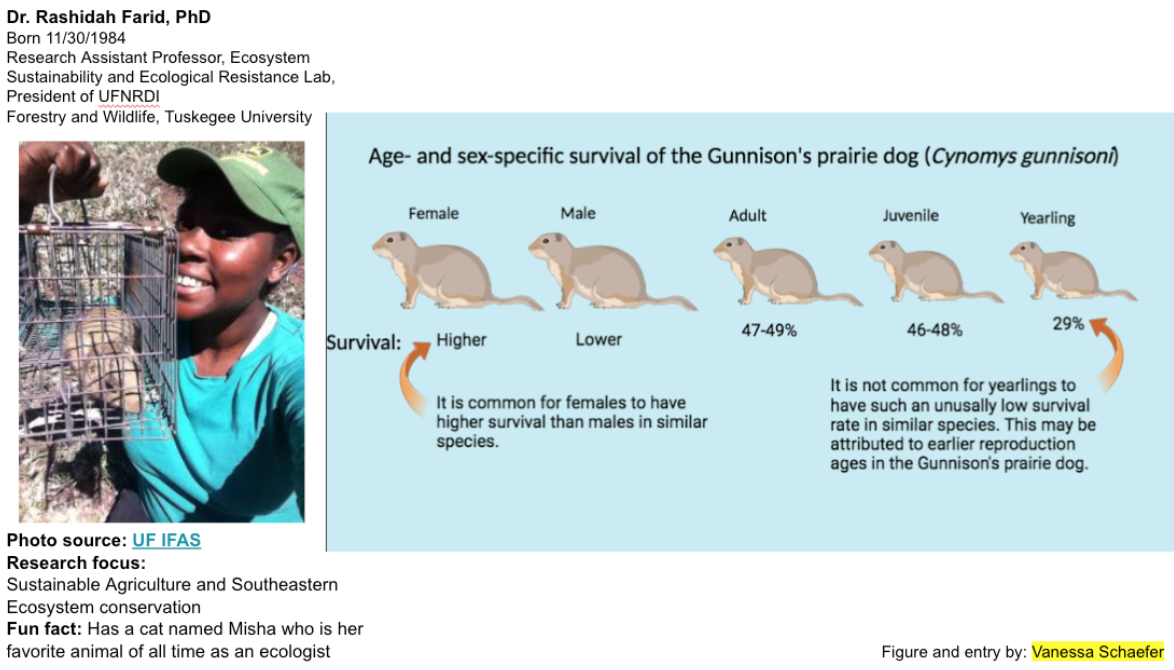
Dr. Rashidah Farid is a professor at Tuskegee University where she also runs her own Ecosystem Sustainability and Ecological Resistance Lab. In the ESER lab, Dr. Farid and her students focus on southeastern conservation and sustainable agriculture. Dr. Farid is a well-rounded ecologist with many areas of study including water pollution, population ecology, the accumulation of heavy metals in soils and trees, and the life history of Gunnison’s Prairie dogs (Figure 1.) In her research, she wanted to find out how age, sex, and reproductive status affect the survival rate of the Gunnison’s Prairie dogs (Cynomys gunnisoni). In this study, the capture-mark-recapture technique was used to estimate populations. It was found that female prairie dogs had higher survival than males. Prairie dogs less than one year had the lowest survival whereas juveniles and adults both had fairly high survival. Unlike many other species of prairie dogs, Gunnison’s Prairie dogs can reproduce as yearlings (one year old). Their survival for yearlings was significantly lower than in other species of prairie dogs. This may be evidence to suggest that reproducing so young may be costly. Research like that of Dr. Rashidah Farid on Gunnison’s Prairie dogs is important because it can help us understand long-term population trends in different organisms.
Robin Wall Kimmerer, Phd
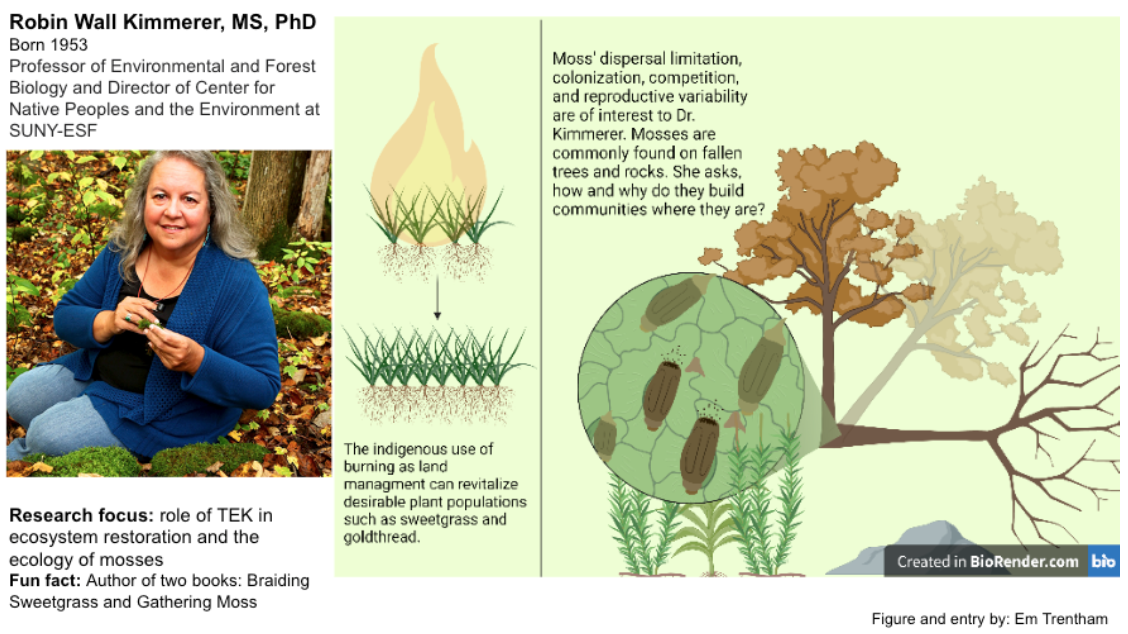
Dr. Kimmerer is one of the few well-known bryologists in the country and asks groundbreaking questions about mosses. She explores competition, symbiotic relationships, dispersal limitation, and reproductive variability in sex. She invokes concepts such as population density, competition mode, isolation on boulders, and the role of disturbance on a population. Her research is mostly based in the Adirondack Mountains in New York.
Dr. Kimmerer explores the integration of traditional and scientific knowledge to strengthen land management practices and restore ecosystems. She has been writing about this integration since 1998, with calls to action and several examples in published articles. In addition to journal articles, Dr. Kimmerer publishes essays and books combining these concepts, which is a delightfully approachable way for general citizens to learn about science topics. This may be the impactful and important work of Dr. Kimmerer, as she is paving the way for traditional knowledge in the academic scientific community.
She also works on the ecological restoration of culturally and ecologically significant plants such as sweetgrass and goldthread, as these plants have an evolved relationship with humans. Her research on revegetation is focused on abandoned mining areas, with bryophytes sometimes playing a role in revegetation.
Charles Nilon

One of Dr. Nilon’s research projects was to understand how urbanization was affecting the bird population by using a long term project to collect data on their species abundance in an area. He originally asked himself how open spaces within a neighborhood could be beneficial to the avian population within a urbanized location. Overall he found that the bird populations not only decreased, but the communities of birds that were present in said area also decreased. Although the use of larger neighborhoods with open space allowed the bird population to thrive more effectively then smaller community neighborhoods.
Phaedra Budy

Dr. Phaedra Budy is a professor in the department of watershed sciences at USU (Utah State University) teaching fisheries ecology and management. She is also the principal investigator for the USGS Fish and Wildlife cooperative research unit at that university. Most of her projects have involved freshwater ecology and stream ecology in Utah focused on native desert fishes and salmonid species across the main drainages in the state (Bear Lake, The Green River, and the Colorado River). She also conducts research across the rest of the southwest and even into far northern alaska. The goal behind most of the research done in her lab is to answer questions about the factors that structure and limit fish populations and fish communities, but she has also published research on multiple other ecological concepts we’ve been exposed to in this class including food web ecology and general community ecology. Her research is highly important as it guides the management decisions of the state of Utah around sensitive aquatic resources and various fish species, some of which are imperiled. A lot of her studies focus on some of the less represented members of various fish communities within the major drainages her research occurs in.
John Roe

Dr. John Roe and his team of undergraduate researchers monitored Eastern Box Turtles (Terrapene carolina) in fire-managed sites in Weymouth Woods State Park and in unburned sites in Lumber River State Park. When a box turtle is found, Dr. Roe and his team would record the turtle’s exact location, measure its shell and weigh the turtle. The data would then be analyzed to see the differences in survivorship and body condition. In their findings they found that survivorship varied across burn units in Weymouth Woods, with low survivorship found in frequent burned areas. While growth rates did not differ among the sites. They concluded that various mortality factors, aside from fire, may have contributed to their findings, and that fire season and sex influenced survivorship, with female turtles experiencing greater mortality than male turtles. This study is important in order to find out why there is a decline in Box Turtles and to find a way to stop this species from going extinct. Throughout Dr. Roe’s career he has published two Box Turtle papers. In March 2021 Dr. Roe’s landmark study of Box Turtles made the cover of Ecosphere Journal while also being the lead author of the paper “Statewide population characteristics and long-term trends in eastern box turtles in North Carolina”. Last year in November he was interviewed for NPR media station about Box turtles. Dr. John Roe is also a part of the 100 year study project of Box Turtles. .
Helen Senn

Dr Helen Senn is passionate about conservation genetics and has informed IUCN conservation plans around the globe, primarily for mammals. Recently, she has also led the Saving Wildcats team in founding the captive breeding and release program for the Scottish wildcat. She was part of the team that determined that the current population of Scottish wildcats in Scotland is functionally extinct due to high amounts of hybridization with domestic cats eliminating “pure” individuals from the original population. Due to Dr Helen Senn’s research, the conservation plan was able to shift to include the introduction of mainland European wildcats before Scottish genetics were completely eliminated. She was also able to show with local ancestry that the rise in domestic cat ownership was a factor in the increase in Scottish wildcat domestication and the decline in pure breeding individuals. Dr Helen Senn focuses on minimum viable populations and the genetic flow of populations in how these factors inform the population’s needs for conservation. Scottish wildcats have become more rare across the landscape and are more likely to cross paths with domestic cats during breeding events, which emphasizes a need for better habitat connectivity to allow successful non-hybrid breeding to occur. Her publications have triggered the targeted use of trap-neuter-vaccinate-release programs in the Cairngorms National Park to clear selected habitats of domestic cats.
Gloria Tom
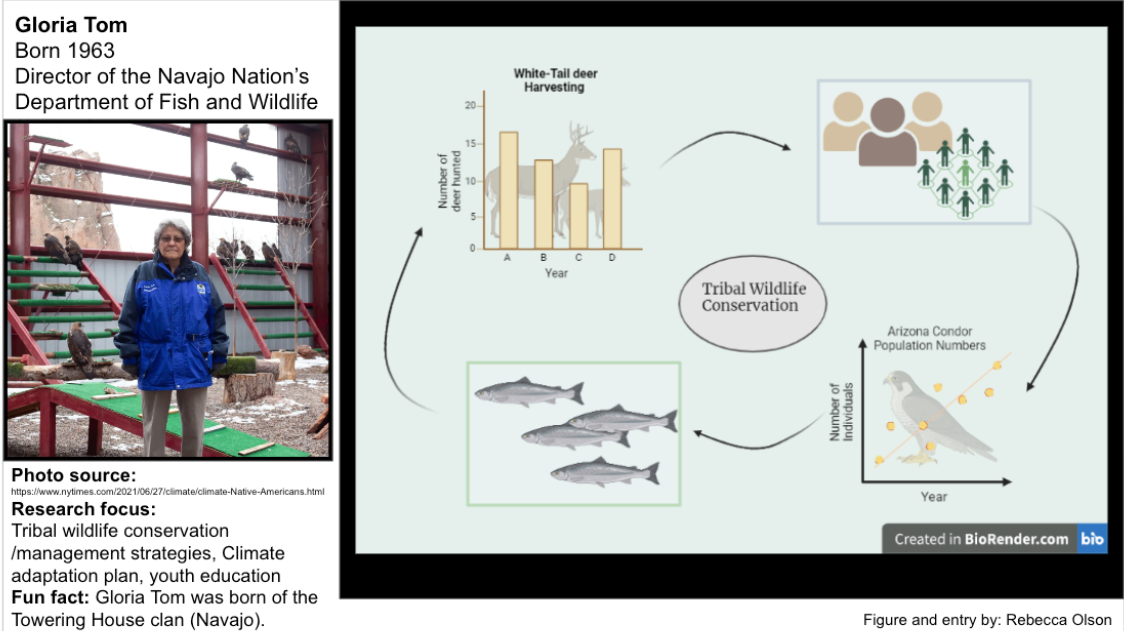
Gloria Tom dedicates her life to wildlife conservation and has served on many projects regarding environmental issues. As a wildlife biologist and environmentalist, she has developed multiple wildlife management programs which encompass big game management and native recreational fish management. Together with the Arizona Game and Fish Department, she has collaborated on law enforcement policies and endangered species management. She also provided significant support to the Arizona condor program that strives to rehabilitate condors and downlist them from their ‘endangered’ status. In 2019, she appeared before the Subcommittee on Water, Oceans, and Wildlife to spread awareness about tribal wildlife conservation efforts and the challenges tribes have faced concerning their involvement in conservation. She also emphasized her support for the Recovering America’s Wildlife Act and the Wildlife Corridors Conservation Act. Within her 36-year career with the Navajo Nation, she also worked with the National Indian Youth Leadership Program which encourages youth to become capable, caring, and resilient individuals through outdoor leadership training and nature-centric activities. Gloria Tom’s desire to bring others into nature also takes form in her diligence to promote responsible and ethical behavior. In particular, she continues to deliver hunter education and collaborate on environmental issues for the residents of the Navajo tribe. Her leadership promotes the unity of traditional knowledge within the scientific community.
James Whitfield Gibbons

James Whitfield Gibbons is a herpetologist at the University of Georgia. Dr. Gibbons research interests are population dynamics, ecology of aquatic and semi aquatic vertebrates, and population studies of amphibians, reptiles and fish. My biorender is based on his study of red eared sliders in degraded ecosystems. Turtles provide many beneficial ecological services like contributing to biomass, energy transfer, mineral cycling, seed distribution, and trophic status. All things that help maintain and improve waterways so when turtles are depleted there are many negative problems to the ecosystem. Dr. Gibbons suggested introducing invasive red-eared sliders into degraded ecosystems in hopes of improving them. Red-eared sliders are very resilient and can survive a wide variety of habitats making them perfect for depleted ecosystems. This paper was published last year so they haven’t done any testing yet, but they believe that the adaptability of red-eared sliders may have value to restoring ecosystems to how they were before degrading.
Susan B Adams

Adams has done extensive research on crayfish populations in both the southeastern United States and Montana. The primary focus of her research is to determine the effects of disturbance on crayfish populations on both the individual and population levels. More specifically, she focuses on how pulse and press disturbances affect crayfish. The most notable impact she found is that in dammed rivers (dams are an example of press disturbance), crayfish diversity is significantly lower than in uninterrupted streams. While disturbances like fire or storms can have a temporary impact on crayfish populations, disturbances like dams or land use changes last much longer and force entire populations of crayfish to change their spawning and movement patterns for many years. Since crayfish are such small organisms, even small changes in stream flow can affect their behavior and habitat, so an entire stream flow being changed is very detrimental to them. These findings imply that many other aquatic species are similarly affected by dams, which leads to severe degradation of stream quality in dammed areas (both upstream and downstream).
Lauren Pharr

Dr. Pharr’s thesis looked at the impacts of urban noise and light pollution on adult avian survivorship. The study found that the urbanization affects avian species in their migration habits, and their circadian rhythms. Dr. Pharr used data from Neighborhood Nestwatch which is a citizen science project that helps collect species presence in urban backyards. The study concluded that light pollution was disturbing avian circadian rhythms, and that noise pollution was changing mating calls and overall avian communication. We looked at something similar in class; one of our jigsaws talked about how birds in more urban environments had higher pitched calls than birds in non-urban environments. Since urban environments tend to be louder and noisier, birds were fighting to be heard. This creates selective pressure for higher pitched calls.
Student contributors:
Note Outline: Raven Yurtal, Anna Nelson, Alison Plumley, Mayla Ngo, Kolby Altabet
Blog Style Summary: Ben Meyer, Andrea Padilla, Nick Reenan, CJ Dierking
Spotlight on NC: Kyla Marze, Trey Jeffers, Nick Terwilliger
Featured Ecologists: Vanessa Schaefer, Em Trentham, Rebecca Olson
How to Apply Ecology in a Changing World: Renée LeClair, Maddie Greenway, Eli Kromer
a group of individuals of the same species, that inhabit a given area
patterns of continuous change over time that take into account birth, death, and migration
a group of genetically identical individuals, such as plants, fungi, or bacteria, that have grown in a given location, all originating vegetatively, not sexually, from a single ancestor
an individual that does not contribute to the sexual diversity of a population
a set of local populations occupying habitat patches, connected to one another by the movement of individuals
a subset of a larger population
Local population of interbreeding individuals

