
3 Natural Selection & Population Genetics
At the end of this chapter, you will be able to:
- explain how natural selection drives evolution
- explain what is meant by the term fitness
- describe how selective pressures drive evolution via natural selection
- describe the conditions necessary for evolution to occur via natural selection
- compare and contrast the different modes of natural selection
- compare and contrast natural selection and sexual selection
- describe the use of the Hardy Weinberg equations
- solve problems using the Hardy Weinberg equations
Introduction
Natural selection is a term that is commonly used; however, it is also misunderstood. Sometimes people will regurgitate “survival of the fittest” to describe the process of natural selection, without understanding what is meant by fitness. Fitness is a term to describe individuals who reproduce more than their peers in a population and therefore leave more descendants who will also reproduce. Fitness is all about reproduction and fitness is relative – meaning it can change when the environment changes.
Let’s start first with some basic definitions and then delve into this process more fully in order to dispel misconceptions.
Natural selection is one of several processes that can result in a change in the frequency of a version of a trait that we see in a population. That is natural selection stimulates evolution. What makes natural selection so interesting and unique compared to other processes that lead to evolution is that the reason for the change in the frequency of the trait is adaptive. That is there is a “reason” we are seeing the change. Individuals in the population that have a version of a trait that allows it to live longer to reproduce more (that is they are more fit) will leave more descendants. These more fit individuals are better adapted to the current environmental pressures. A particular environmental stimulus or selective pressure is allowing these individuals (with a particular genotype or genetic variation) to live longer and reproduce more.
Another way of describing this is to say that selective pressure is an evolutionary force in the environment that causes a particular phenotype (physical appearance or trait) and its accompanying genotype (genetic makeup) to be more favorable in that environmental conditions. When scientists use the term genotype they are describing all the genetic coding and DNA that makes up the cells of an individual. Often, the focus is on a particular trait that is dictated by the DNA of the cell. A trait (say length of femur, the phenotype) is coded by the DNA. The DNA is made up of 4 bases, adenine (A), guanine (G), cytosine (C(, and thymine (T) in a unique order for the trait, which we would call a gene. So a gene codes for a trait. On average a gene is about 2000 bases long. Because that is a lot of bases to write down, scientists will use short-hand notation for a gene. Instead of writing AAATCGGACGCC…… we will summarize this DNA as “A” for example. Typically, scientists use uppercase letters to illustrate that this version is dominant and lowercase letters when the version of DNA is recessive.
We can also use the terminology of an allele. An allele is a code for a trait. An allele is one of two or more versions of a DNA sequence for a trait. An individual will inherit two alleles, one from the mother and one from the father, for any given gene in question (note there are some exceptions to this with sex-linked traits). If the two alleles are the same (AA or aa), we use the term homozygous (the individual is homozygous for the trait), and if the alleles are different (Aa), we use the term heterozygous.
Natural selection only acts on the population’s heritable traits: selecting for beneficial alleles (that is “allowing” individuals with adaptive traits to live longer and reproduce more) and thus increasing their frequency in the population, while selecting against deleterious alleles and thereby decreasing their frequency—a process known as adaptive evolution. Natural selection does not act on individual alleles, however, but on entire organisms. An individual may carry a very beneficial genotype with a resulting phenotype that, for example, increases the ability to reproduce (fecundity), but if that same individual also carries an allele that results in a fatal childhood disease, that fecundity phenotype will not be passed on to the next generation because the individual will not live to reach reproductive age. Natural selection acts at the level of the individual; it selects for individuals with greater contributions to the gene pool of the next generation, known as an organism’s evolutionary (Darwinian) fitness. The change that we see with evolution is occurring at the population level. Again, populations evolve over time. The allelic frequencies of a trait will change over time given new environmental pressures.
Watch this short summary video that ties things together.
There are several ways selection can affect population variation: stabilizing selection, directional selection, diversifying selection, frequency-dependent selection, and sexual selection. As natural selection influences the allele frequencies in a population, individuals can either become more or less genetically similar and the phenotypes displayed can become more similar or more disparate.
Stabilizing Selection
If natural selection favors an average phenotype, selecting against extreme variation, the population will undergo stabilizing selection (Fig 1). In a population of mice that live in the woods, for example, natural selection is likely to favor individuals that best blend in with the forest floor and are less likely to be spotted by predators. These camouflage mice are more adapted to that environment and they will be more fit (reproducing more and leaviing more descendants). Assuming the ground is a fairly consistent shade of brown, those mice whose fur is most closely matched to that color will be most likely to survive and reproduce, passing on their genes for their brown coat. Mice that carry alleles that make them a bit lighter or a bit darker will stand out against the ground and be more likely to fall victim to predation. As a result of this selection, the population’s genetic variance will decrease.
Directional Selection
When the environment changes, populations will often undergo directional selection (Fig 1), which selects for phenotypes at one end of the spectrum of existing variation. A classic example of this type of selection is the evolution of the peppered moth in eighteenth- and nineteenth-century England. Prior to the Industrial Revolution, the moths were predominately light in color, which allowed them to blend in with the light-colored trees and lichens in their environment. But as soot began spewing from factories, the trees became darkened, and the light-colored moths became easier for predatory birds to spot. Over time, the frequency of the melanic form of the moth increased because they had a higher survival rate in habitats affected by air pollution because their darker coloration blended with the sooty trees. Similarly, the hypothetical mouse population may evolve to take on a different coloration if something were to cause the forest floor where they live to change color. The result of this type of selection is a shift in the population’s genetic variance toward the new, fit phenotype.
Diversifying or Disruptive Selection
Sometimes two or more distinct phenotypes can each have their advantages and be selected for by natural selection, while the intermediate phenotypes are, on average, less fit. Known as diversifying or disruptive selection (Fig 1), this is seen in many populations of animals that have multiple male forms. Large, dominant alpha males obtain mates by brute force, while small males can sneak in for furtive copulations with the females in an alpha male’s territory. In this case, both the alpha males and the “sneaking” males will be selected for, but medium-sized males, which can’t overtake the alpha males and are too big to sneak copulations, are selected against. Diversifying selection can also occur when environmental changes favor individuals on either end of the phenotypic spectrum. Imagine a population of mice living at the beach where there is light-colored sand interspersed with patches of tall grass. In this scenario, light-colored mice that blend in with the sand would be favored, as well as dark-colored mice that can hide in the grass. Medium-colored mice, on the other hand, would not blend in with either the grass or the sand, and would thus be more likely to be eaten by predators. The result of this type of selection is increased genetic variance as the population becomes more diverse.
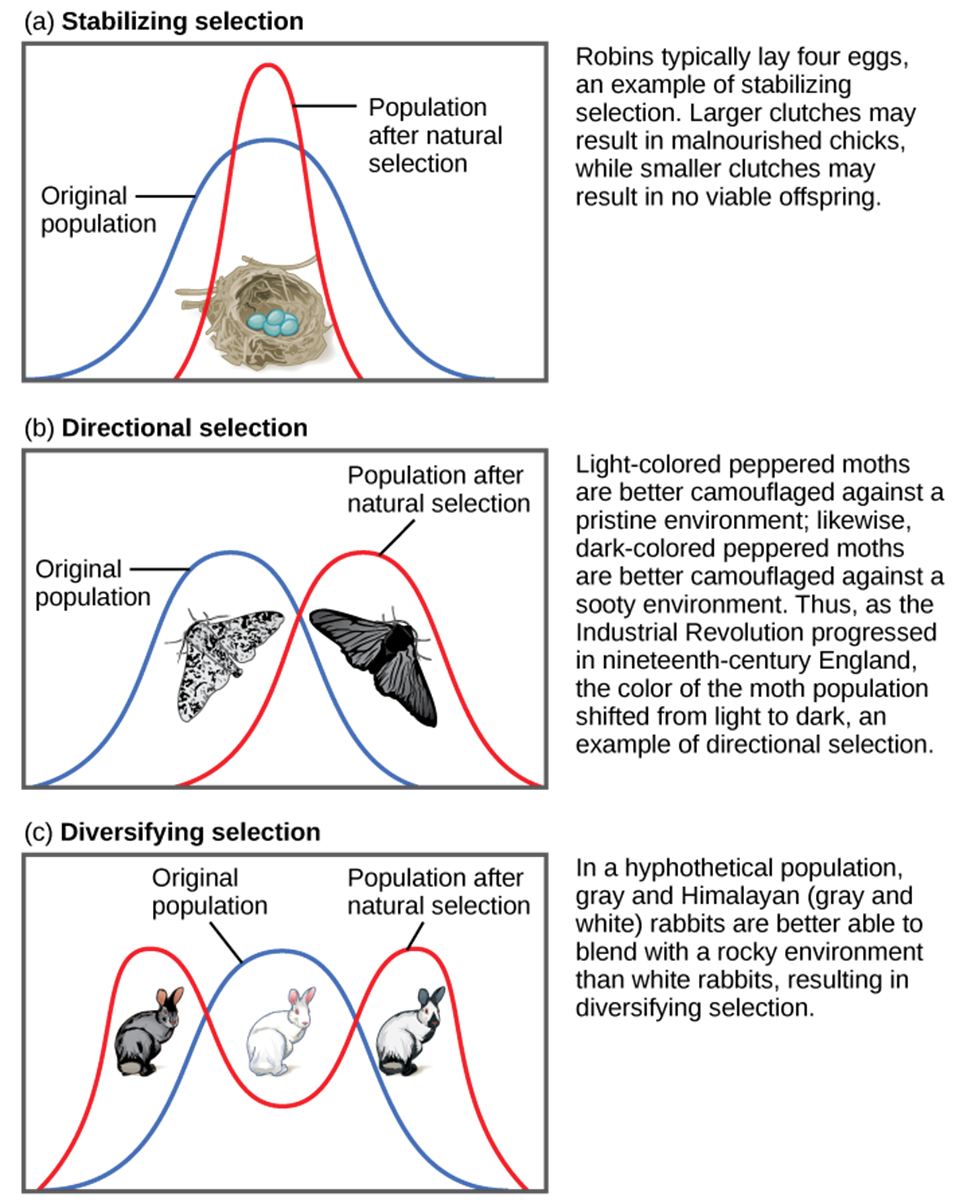
Figure 1: Different types of natural selection can impact the distribution of phenotypes within a population. In (a) stabilizing selection, an average phenotype is favored. In (b) directional selection, a change in the environment shifts the spectrum of phenotypes observed. In (c) diversifying selection, two or more extreme phenotypes are selected for, while the average phenotype is selected against. (credit: “types of selection” by OpenStax is licensed under CC BY 4.0)
Frequency-Dependent Selection
Another type of selection, called frequency-dependent selection, favors phenotypes that are either common (positive frequency-dependent selection) or rare (negative frequency-dependent selection). An interesting example of this type of selection is seen in a unique group of lizards of the Pacific Northwest. Male common side-blotched lizards come in three throat-color patterns: orange, blue, and yellow. Each of these forms has a different reproductive strategy: orange males are the strongest and can fight other males for access to their females; blue males are medium-sized and form strong pair bonds with their mates; and yellow males (Fig 2) are the smallest, and look a bit like females, which allows them to sneak copulations. Like a game of rock-paper-scissors, orange beats blue, blue beats yellow, and yellow beats orange in the competition for females. That is, the big, strong orange males can fight off the blue males to mate with the blue’s pair-bonded females, the blue males are successful at guarding their mates against yellow sneaker males, and the yellow males can sneak copulations from the potential mates of the large, polygynous orange males.
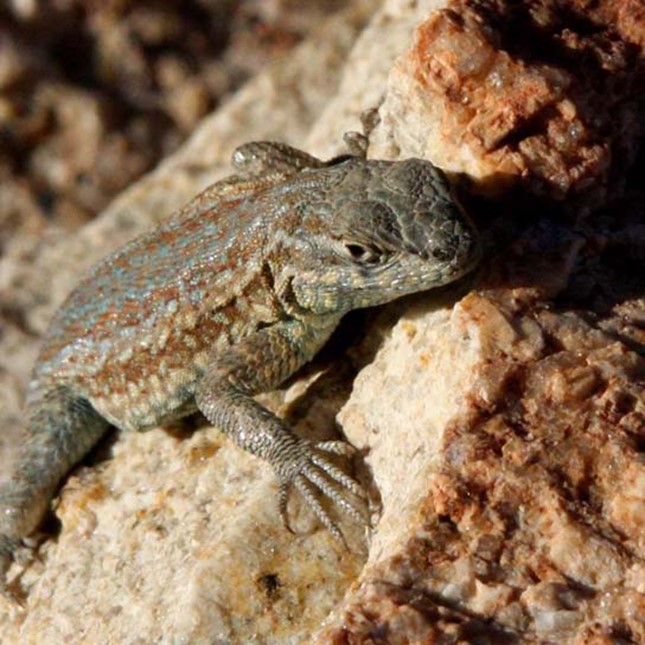
Figure 2: A yellow-throated side-blotched lizard is smaller than either the blue-throated or orange-throated males and appears a bit like the females of the species, allowing it to sneak copulations. (credit: “tinyfroglet”/Flickr. “tinyfroglet” by OpenStax is licensed under CC BY 4.0)
In this scenario, orange males will be favored by natural selection when the population is dominated by blue males, blue males will thrive when the population is mostly yellow males, and yellow males will be selected for when orange males are the most populous. As a result, populations of side-blotched lizards cycle in the distribution of these phenotypes—in one generation, orange might be predominant, and then yellow males will begin to rise in frequency. Once yellow males make up a majority of the population, blue males will be selected for. Finally, when blue males become common, orange males will once again be favored.
Negative frequency-dependent selection serves to increase the population’s genetic variance by selecting for rare phenotypes, whereas positive frequency-dependent selection usually decreases genetic variance by selecting for common phenotypes.
Sexual Selection
Males and females of certain species are often quite different from one another in ways beyond the reproductive organs. Males are often larger, for example, and display many elaborate colors and adornments, like the peacock’s tail, while females tend to be smaller and duller in decoration. Such differences are known as sexual dimorphisms (Fig 3), which arise from the fact that in many populations, particularly animal populations, there is more variance in the reproductive success of the males than there is of the females. That is, some males—often the bigger, stronger, or more decorated males—get the vast majority of the total matings, while others receive none. This often occurs because females will choose to mate with the bigger or more decorated males. This variation in reproductive success generates a strong selection pressure among males to get those matings, resulting in the evolution of bigger body size and elaborate ornaments to get the females’ attention. Females, on the other hand, tend to get a handful of selected matings; therefore, they are more likely to select more desirable males.
Sexual dimorphism varies widely among species, of course, and some species are even sex-role reversed. In such cases, females tend to have a greater variance in their reproductive success than males and are correspondingly selected for the bigger body size and elaborate traits usually characteristic of males.
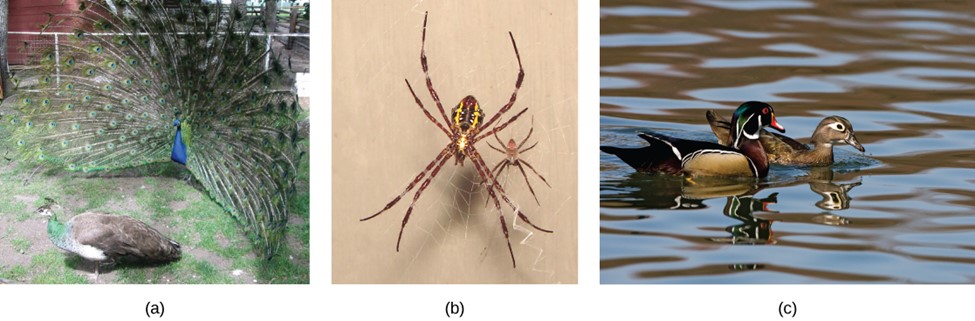
Figure 3: Sexual dimorphism is observed in (a) peacocks and peahens, (b) Argiope appensa spiders (the female spider is the large one), and in (c) wood ducks. (credit “spiders”: modification of work by “Sanba38”/Wikimedia Commons; credit “duck”: modification of work by Kevin Cole. “this image” by OpenStax is licensed under CC BY 4.0)
Darwin noticed this dimorphism and wondered why males of many species seemed to be more colorful and ornate than females of that same species who were duller in color and didn’t possess the same “showy” traits. He knew the pressures on males to attract females and not the other way around would be higher because females had fewer gametes (eggs) compared to males with many more gametes (sperm). Because eggs were expensive to make as a result compared to “cheaper” sperm, females should be more selective of their mates. This would drive females to be more discriminatory in their selection, setting the stage for sexual selection.
Sexual selection can result in the development of secondary sexual characteristics that do not benefit the individual’s likelihood of survival but help to maximize its reproductive success. Sexual selection favors traits that will secure matings for individuals and increase their chances of leaving offspring. Natural selection favors traits for survival and can sometimes get confused with sexual selection since individuals do need to reproduce to pass on these traits; however, it is the trait that is adaptive to survival that is being selected for. With sexual selection, individuals have to reproduce to pass on these traits as well; however, the traits being selected for are the ones that offer a benefit for securing matings, or fertilizing eggs, or helping attract mates. Sometimes a trait can be BOTH naturally selected and sexually selected. For example, if large size allows for survival (over smaller size) because a male is able to gain more food and energy as a result, it would be under natural selection. If females prefer large males as mates and find these males more attractive, size is also under sexual selection.
Sexual selection can be so strong that it selects for traits that are actually detrimental to the individual’s survival. Think, once again, about the peacock’s tail. While it is beautiful and the male with the largest, most colorful tail is more likely to win the female, it is not the most practical appendage. In addition to being more visible to predators, it makes the males slower in their attempted escapes. There is some evidence that this risk, in fact, is why females like the big tails in the first place. The speculation is that large tails carry risk, and only the best males survive that risk: the bigger the tail, the more fit the male. This idea is known as the handicap principle.
The good genes hypothesis states that males develop these impressive ornaments to show off their efficient metabolism or their ability to fight disease. Females then choose males with the most impressive traits because it signals their genetic superiority, which they will then pass on to their offspring. Though it might be argued that females should not be picky because it will likely reduce their number of offspring, if better males father more fit offspring, it may be beneficial. Fewer, healthier offspring may increase the chances of survival more than many, weaker offspring.
In both the handicap principle and the good genes hypothesis, the trait is said to be an honest signal of the males’ quality, thus giving females a way to find the fittest mates— males that will pass the best genes to their offspring.
In 1915, biologist Ronald Fisher proposed another model of sexual selection: the Fisherian runaway model, which suggests that selection of certain traits is a result of sexual preference. In this case, the secondary characteristic of the males would continue to grow or “runaway” until natural selection acted as a counterbalance. For example, a long tail might be more attractive to females so they choose these males to mate with and the next generation of male birds has longer tails as a result. This will continue to occur, with males having the longest tails securing more matings, until there is a survival disadvantage. If longer tails make it harder to fly, or harder to secure food, or easier for predators to kill, natural selection will start working in the opposite direction.
No Perfect Organism
Natural selection is a driving force in evolution and can generate populations that are better adapted to survive and successfully reproduce in their environments. But natural selection cannot produce the perfect organism. Natural selection can only select on existing variation in the population; it does not create anything from scratch. Thus, it is limited by a population’s existing genetic variance and whatever new alleles arise through mutation and gene flow.
Natural selection is also limited because it works at the level of individuals, not alleles, and some alleles are linked due to their physical proximity in the genome, making them more likely to be passed on together (linkage disequilibrium). Any given individual may carry some beneficial alleles and some unfavorable alleles. It is the net effect of these alleles, or the organism’s fitness, upon which natural selection can act. As a result, good alleles can be lost if they are carried by individuals that also have several overwhelmingly bad alleles; likewise, bad alleles can be kept if they are carried by individuals that have enough good alleles to result in an overall fitness benefit.
Furthermore, natural selection can be constrained by the relationships between different polymorphisms. One morph may confer a higher fitness than another, but may not increase in frequency due to the fact that going from the less beneficial to the more beneficial trait would require going through a less beneficial phenotype. Think back to the mice that live at the beach. Some are light-colored and blend in with the sand, while others are dark and blend in with the patches of grass. The dark-colored mice may be, overall, more fit than the light-colored mice, and at first glance, one might expect the light-colored mice be selected for a darker coloration. But remember that the intermediate phenotype, a medium-colored coat, is very bad for the mice—they cannot blend in with either the sand or the grass and are more likely to be eaten by predators. As a result, the light-colored mice would not be selected for a dark coloration because those individuals that began moving in that direction (began being selected for a darker coat) would be less fit than those that stayed light.
Finally, it is important to understand that not all evolution is adaptive. While natural selection selects the fittest individuals and often results in a more fit population overall, other forces of evolution, including genetic drift and gene flow, often do the opposite: introducing deleterious alleles to the population’s gene pool. Evolution has no purpose—it is not changing a population into a preconceived ideal. It is simply the sum of the various forces described in this chapter and how they influence the genetic and phenotypic variance of a population.
Neo-Darwinism and Modern Natural Selection
Darwin is credited with the theory of natural selection; however, he did not understand the roles of mutations and the potential creation of a new version of a trait or a new allele. Darwin’s ideas were revolutionary and focused on how populations might change over time with existing allelic frequencies, not new versions. He envisioned going from a population of organisms with more “A” version of a trait to, with a selective pressure, a population with now more “a” version of that trait. When the environment changed again, the “A” version of the trait would be favored again.
Modern synthesis describes how evolutionary processes, such as natural selection with mutations introducing new versions of a trait, can affect a population’s genetic makeup, and, in turn, how this can result in the gradual evolution of populations and species. The theory also connects this change of a population over time, called microevolution, with the processes that gave rise to new species and higher taxonomic groups with widely divergent characters, called macroevolution.
Evolution and Flu Vaccines
Every fall, the media starts reporting on flu vaccinations and potential outbreaks. Scientists, health experts, and institutions determine recommendations for different parts of the population, predict optimal production and inoculation schedules, create vaccines, and set up clinics to provide inoculations. You may think of the annual flu shot as a lot of media hype, an important health protection, or just a briefly uncomfortable prick in your arm. But do you think of it in terms of evolution?
The media hype of annual flu shots is scientifically grounded in our understanding of evolution. Each year, scientists across the globe strive to predict the flu strains that they anticipate being most widespread and harmful in the coming year. This knowledge is based on how flu strains have evolved over time and over the past few flu seasons. Scientists then work to create the most effective vaccine to combat those selected strains. Hundreds of millions of doses are produced in a short period in order to provide vaccinations to key populations at the optimal time.
Because viruses, like the flu, evolve very quickly (especially in evolutionary time), this poses quite a challenge. Viruses mutate and replicate at a fast rate, so the vaccine developed to protect against last year’s flu strain may not provide the protection needed against the coming year’s strain. The evolution of these viruses means continued adaptions to ensure survival, including adaptations to survive previous vaccines.
Population Genetics
Recall that a gene for a particular character may have several alleles, or variants, that code for different traits associated with that character. For example, in the ABO blood type system in humans, three alleles determine the particular blood-type protein on the surface of red blood cells. Each individual in a population of diploid organisms can only carry two alleles for a particular gene, but more than two may be present in the individuals that make up the population. Mendel followed alleles as they were inherited from parent to offspring. In the early twentieth century, biologists in a field of study known as population genetics began to study how selective forces change a population through changes in allele and genotypic frequencies.
The allele frequency (or gene frequency) is the rate at which a specific allele appears within a population. Until now we have discussed evolution as a change in the characteristics of a population of organisms, but behind that phenotypic change is genetic change. In population genetics, the term evolution is defined as a change in the frequency of an allele in a population. Using the ABO blood type system as an example, the frequency of one of the alleles, IA, is the number of copies of that allele divided by all the copies of the ABO gene in the population. For example, a study in Jordan found a frequency of IA to be 26.1 percent (Hanania, Hassawi, & Irshaid, 2007). The IB and I0 alleles made up 13.4 percent and 60.5 percent of the alleles respectively, and all of the frequencies added up to 100 percent. A change in this frequency over time would constitute evolution in the population.
The allele frequency within a given population can change depending on environmental factors; therefore, certain alleles become more widespread than others during the process of natural selection. Natural selection can alter the population’s genetic makeup; for example, if a given allele confers a phenotype that allows an individual to better survive or have more offspring. Because many of those offspring will also carry the beneficial allele, and often the corresponding phenotype, they will have more offspring of their own that also carry the allele, thus, perpetuating the cycle. Over time, the allele will spread throughout the population. Some alleles will quickly become fixed in this way, meaning that every individual of the population will carry the allele, while detrimental mutations may be swiftly eliminated if derived from a dominant allele from the gene pool. The gene pool is the sum of all the alleles in a population.
Sometimes, allele frequencies within a population change randomly with no advantage to the population over existing allele frequencies. This phenomenon is called genetic drift. Natural selection and genetic drift usually occur simultaneously in populations and are not isolated events. It is hard to determine which process dominates because it is often nearly impossible to determine the cause of change in allele frequencies at each occurrence. An event that initiates an allele frequency change in an isolated part of the population, which is not typical of the original population, is called the founder effect. Natural selection, random drift, and founder effects can lead to significant changes in the genome of a population.
Hardy-Weinberg Principle of Equilibrium
In the early twentieth century, English mathematician Godfrey Hardy and German physician Wilhelm Weinberg stated the principle of equilibrium to describe the genetic makeup of a population. The theory, which later became known as the Hardy-Weinberg principle of equilibrium, states that a population’s allele and genotype frequencies are inherently stable— unless some kind of evolutionary force is acting upon the population, neither the allele nor the genotypic frequencies would change. The Hardy-Weinberg principle assumes conditions with no mutations, migration, emigration, or selective pressure for or against genotype, plus an infinite population. While no population can satisfy those conditions, the principle offers a useful model against which to compare real population changes.
Working under this theory, population geneticists represent different alleles as different variables in their mathematical models. The variable p represents the dominant allele in the population while the variable q represents the recessive allele. For example, when looking at Mendel’s peas, the variable p represents the frequency of y alleles that confer the color yellow and the variable q represents the frequency of y alleles that confer the color green. If these are the only two possible alleles for a given locus in the population, p + q = 1. In other words, all the p alleles and all the q alleles make up all of the alleles for that locus that are found in the population.
But what ultimately interests most biologists is not the frequencies of different alleles, but the frequencies of the resulting genotypes, known as the population’s genetic structure, from which scientists can surmise the distribution of phenotypes. If the phenotype is observed, only the genotype of the homozygous recessive alleles can be known; the calculations provide an estimate of the remaining genotypes.
Since each individual carries two alleles per gene, if the allele frequencies (p and q) are known, predicting the frequencies of these genotypes is a simple mathematical calculation to determine the probability of getting these genotypes if two alleles are drawn at random from the gene pool. So in the above scenario, an individual pea plant could be pp (YY), and thus produce yellow peas; pq (Yy), also yellow; or qq (yy), and thus producing green peas (Fig 4). In other words, the frequency of pp individuals is simply p2; the frequency of pq individuals is 2pq; and the frequency of qq individuals is q2. And, again, if p and q are the only two possible alleles for a given trait in the population, these genotype frequencies will sum to one: p2 + 2pq + q2 = 1.

Figure 4: When populations are in the Hardy-Weinberg equilibrium, the allelic frequency is stable from generation to generation and the distribution of alleles can be determined from the Hardy-Weinberg equation. If the allelic frequency measured in the field differs from the predicted value, scientists can make inferences about what evolutionary forces are at play. (credit: “Hardy-Weinberg equilibrium” by OpenStax is licensed under CC BY 4.0)
This video is a nice summary of how to use Hardy-Weinberg to study population genetics.
In theory, if a population is at equilibrium—that is, there are no evolutionary forces acting upon it—generation after generation would have the same gene pool and genetic structure, and these equations would all hold true all of the time. Of course, even Hardy and Weinberg recognized that no natural population is immune to evolution. Populations in nature are constantly changing in genetic makeup due to drift, mutation, possibly migration, and selection. As a result, the only way to determine the exact distribution of phenotypes in a population is to go out and count them. But the Hardy-Weinberg principle gives scientists a mathematical baseline of a non-evolving population to which they can compare evolving populations and thereby infer what evolutionary forces might be at play. If the frequencies of alleles or genotypes deviate from the value expected from the Hardy-Weinberg equation, then the population is evolving.
Hardy Weinberg Examples
Let’s take a look at how to solve some problems together. There are two important “rules” to keep in mind. Firstly, always start with the recessive. Because there is only one genotype to express the recessive version of the trait, it makes it clear. (With the dominant version of a trait there are two possible genotypes – homozygous dominant and heterozygous – this complicates things a bit, so we wait to determine what is going on with these genotypes until after we figure out the recessive).
Secondly, remember that a genotype or expression of a trait is dictated by two alleles and therefore the equation that deals with 2 alleles is for traits, individuals, genotypes. That is the expression p2 + 2pq + q2 = 1 will deal with genotypes and traits you can see (like black cats, or crooked fingers, etc.). If you are trying to determine an allele, then you just focus on one piece of information (for example, “p” for the dominant allele).
Example #1
A population of crickets is composed of both loud chirpers and soft chirpers. This trait is determined by genes, with the loud chirping allele being dominant to the soft chirping allele.
There are 48 loud chirpers and 14 soft chirpers in the population. What percentage of crickets is heterozygous for loud chirping?
Step 1: Start with the recessive
We need to know what % of the population are soft chirpers. 14 crickets out of a total of 62 animals. Since these are individuals and since it is a genotype we are looking at q2. That means 14/62 or 0.225 are soft chirpers.
Step 2: What is the recessive allele frequency?
Since 0.225 is q2, we can take the square root of this to get q. This value is 0.474.
Step 3: Now that we have the recessive allele frequency, determine the dominant allele frequency.
Use the equation p + q = 1 and rearrange to be p = 1 – q
We know that q is 0.474 so plug this in
p = 1 – 0.474 = 0.526
Step 4: Determine what part of the equation you need to solve for and then answer the question
We need to know what the heterozygous frequency is so we are looking at 2pq
We have p and q determined already so we just need to plug in the values.
2 X 0.526 X 0.474 = 0.498
This means that ~50% (rounding up) of the cricket population is heterozygous for loud chirping.
Example #2
In a population of 162 rabbits, 34 of them express a recessive trait. What is the allelic frequency for this trait? Assuming Hardy-Weinberg equilibrium, how many rabbits would you expect to have the recessive trait the following year when 250 rabbits are present?
Step 1: Start with the recessive and find the recessive allele frequency
34 out of 162 have the recessive genotype or trait. That means that 0.209 or ~21% of the rabbits have this recessive trait. This is the q2 value.
In order to find the allelic frequency, you need to take the square root of 0.21, which is 0.46. This is q.
Step 2: Apply this frequency to determine the prediction for the following year
Remember 0.46 is q (allele) and 0.21 is q2 (genotype). If we have 250 rabbits, we can use the percentage and apply it.
That is, we expect ~21% of the rabbits to have the recessive trait.
So 0.21 X 250 rabbits = 52.5 or 53 rabbits
If there is no evolution and equilibrium remains, we expect that 53 rabbits out of the 250 will be exhibiting the recessive trait
(As a double-check, you can take 53 out of 250 and you will find that 0.21 frequency for the recessive trait. This tells us we did the problem correctly).
Summary
Because natural selection acts to increase the frequency of beneficial alleles and traits while decreasing the frequency of deleterious qualities, it is adaptive evolution. Natural selection acts at the level of the individual, selecting for those that have a higher overall fitness compared to the rest of the population. If the fit phenotypes are those that are similar, natural selection will result in stabilizing selection, and an overall decrease in the population’s variation. Directional selection works to shift a population’s variance toward a new, fit phenotype, as environmental conditions change. In contrast, diversifying selection results in increased genetic variance by selecting for two or more distinct phenotypes.
Other types of selection include frequency-dependent selection, in which individuals with either common (positive frequency-dependent selection) or rare (negative frequency-dependent selection) are selected for. Finally, sexual selection results from the fact that one sex has more variance in the reproductive success than the other. As a result, males and females experience different selective pressures, which can often lead to the evolution of phenotypic differences, or sexual dimorphisms, between the two.
Questions
Glossary
References
Hanania, S., Hassawi, D., and Irshaid, N. 2007. “Allele Frequency and Molecular Genotypes of ABO Blood Group System in a Jordanian Population,” Journal of Medical Sciences 7: 51-58, doi:10.3923/jms.2007.51.58.
Kosal, E. 2023. Introduction and Hardy Weinberg examples. NC State University.
OpenStax, Biology. OpenStax CNX. June 25, 2020. 19.1 Population Evolution found at https://openstax.org/books/biology/pages/19-1-population-evolution
OpenStax, Biology. OpenStax CNX. June 25, 2020. 19.3 Adaptive Evolution found at https://openstax.org/books/biology/pages/19-3-adaptive-evolution
