
2 Phylogeny & The Importance of DNA
By the end of this section, you will be able to do the following:
- Compare homologous and analogous traits
- Discuss the purpose of cladistics in understanding evolutionary relationships
- Describe how evolutionary trees or cladograms are built
- Explain how maximum parsimony is used to help construct evolutionary trees
- Explain why relationships between species can be misinterpreted
- Describe how DNA sequencing works
- Compare and contrast paralogs to orthologs
- Describe the value of studying phylogeny
Introduction
Phylogeny is the study of the evolutionary relationships between organisms. Scientists often want to understand patterns and identify evolutionary trends. This can be accomplished by determining who is most closely related to whom. Scientists can look for clues of the relationship by looking at physical traits (phenotype), how embryos are developing, behaviors, and molecular data (such as DNA or proteins). Scientists must collect accurate information that allows them to make evolutionary connections among organisms and while this seems straightforward, it is sometimes very difficult. Sometimes species will look similar, but not be related. Other times DNA changes might not be detected properly and you can get a misleading understanding of the relationship. Similar to detective work, scientists must use evidence to uncover the facts. In the case of phylogeny, evolutionary investigations focus on two types of evidence: morphologic (form and function) and genetic.
Once scientists have these relationships established, they often show them in diagram form. The evolutionary tree is a hypothesis based on available information but may change as more data are collected. These evolutionary trees place organisms that are more closely related to one another closer together on the tree and those that are more distantly related further apart (Fig 1).
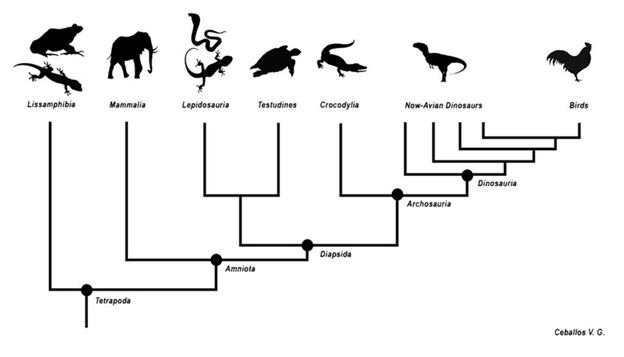
Figure 1: An example of an evolutionary tree. The closer two species are to one another on the tree, the more traits they share and the more closely related they are. For example, Lepidosauria and Testudines are closely related. Birds and Lissamphibia are distantly related because they are far away from each other on this evolutionary tree.
Why Does Phylogeny Matter?
Using such evolutionary trees can be helpful to understand the evolution of certain traits, when these traits evolved, and can also be used in a more practical way. For example, scientists have used such trees to help with conservation efforts, to predict what extinct species may have behaved like, and whether an organism is a distant species, a hybrid, or a mislabeled unique species.
Evolutionary biologists could list many reasons why understanding phylogeny is important to everyday life in human society. For botanists, phylogeny acts as a guide to discovering new plants that can be used to benefit people. Think of all the ways humans use plants—food, medicine, and clothing are a few examples. If a plant contains a compound which is effective in treating cancer, scientists might want to examine all of the compounds for other useful drugs.
A research team in China identified a DNA segment that they thought to be common to some medicinal plants in the family Fabaceae (the legume family). They worked to identify which species had this segment (Fig 2). After testing plant species in this family, the team found a DNA marker (a known location on a chromosome that enabled them to identify the species) present. Then, using the DNA to uncover phylogenetic relationships, the team could identify whether a newly discovered plant was in this family and assess its potential medicinal properties.

Figure 2: Dalbergia sissoo (D. sissoo) is in the Fabaceae, or legume family. Scientists found that D. sissoo shares a DNA marker with species within the Fabaceae family that have antifungal properties. Subsequently, researchers found that D. sissoo had fungicidal activity, supporting the idea that DNA markers are useful to screen plants with potential medicinal properties.
Traits to Help Distinguish Relationships
In general, organisms that share similar phenotype (physical features) and genomes (the totality of DNA found in the cells of organisms) are more closely related than those that do not. The more traits organisms share, the more closely related they are assumed to be. We refer to features that overlap morphologically (physical form) and also genetically based on coming from a common ancestor as homologous structures. They stem from developmental similarities passed down from a common ancestor over evolutionary time. For example, the bones in bat and bird wings have homologous structures (Fig 3).
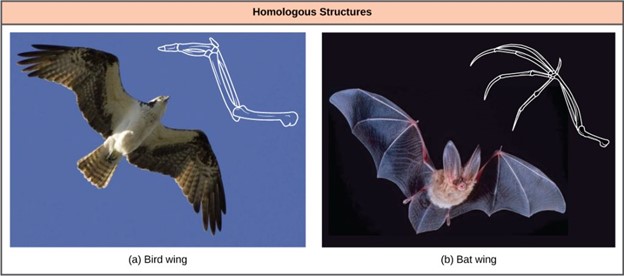
Figure 3: Bat and bird wings are homologous structures, indicating that bats and birds share a common evolutionary past. (credit a: modification of work by Steve Hillebrand, USFWS; credit b: modification of work by U.S. DOI BLM)
Notice it is not simply a single bone, but rather a grouping of several bones arranged similarly. The more complex the feature, the more likely any kind of overlap is due to a common evolutionary past. Imagine two people from different countries both inventing a car with all the same parts and in the same arrangement without any previous or shared knowledge. That outcome would be highly improbable. If two people, however, both invented a hammer, we can reasonably conclude that both could have the original idea without the help of the other. The same relationship between complexity and shared evolutionary history is true for homologous structures in organisms.
Misleading Appearances
Some organisms may be very closely related, even though a minor genetic change caused a major morphological difference to make them look quite different. Similarly, unrelated organisms may be distantly related, but appear alike. This usually happens because both organisms have common adaptations that evolved within similar environmental conditions or similar selective pressures. When similar characteristics occur because of environmental constraints and not due to a close evolutionary relationship, it is an analogy or homoplasy. For example, insects use wings to fly like bats and birds, but the wing structure and embryonic origin are completely different. These are analogous structures (Fig 4).
Similar traits can be either homologous or analogous. Homologous structures share a similar embryonic origin and stem from a common evolutionary ancestor. Analogous organs have a similar function but are not derived from a common ancestor. For example, the bones in a whale’s front flipper are homologous to the bones in the human arm. They stem from a common ancestor; these structures are not analogous.
A butterfly or bird’s wings are analogous but not homologous. As such, over time, the shape of these animals’ wings began to look and function alike due to the environmental constraints of flight. To reduce drag and increase lift, the form of wings evolved. The wings of birds and butterflies look alike due to these selective pressures, NOT due to a common ancestor. The wings are analogous to each other.

Figure 4: The (c) wing of a honeybee is similar in shape to a (b) bird wing and (a) bat wing, and it serves the same function. However, the honeybee wing is not composed of bones and has a distinctly different structure and embryonic origin. These wing types (insect versus bat and bird) illustrate an analogy—similar structures that do not share an evolutionary history. (credit a: modification of work by U.S. DOI BLM; credit b: modification of work by Steve Hillebrand, USFWS; credit c: modification of work by Jon Sullivan)
Molecular Comparisons
The advancement of DNA technology has given rise to molecular systematics, which is the use of molecular data in taxonomy and biological geography (biogeography). New computer programs confirm many earlier classified organisms and also uncover previously made errors. As with physical characteristics, the DNA sequence can be tricky to read in some cases. In some situations, two very closely related organisms can appear unrelated if a mutation occurred that caused a shift in the genetic code. Inserting or deleting a mutation would move each nucleotide base over one place, causing two similar codes to appear unrelated.
Sometimes two segments of DNA code in distantly related organisms randomly share a high percentage of bases in the same locations, causing these organisms to appear closely related when they are not. For both of these situations, computer technologies help identify the actual relationships, and, ultimately, the coupled use of both morphologic and molecular information is more effective in determining phylogeny.
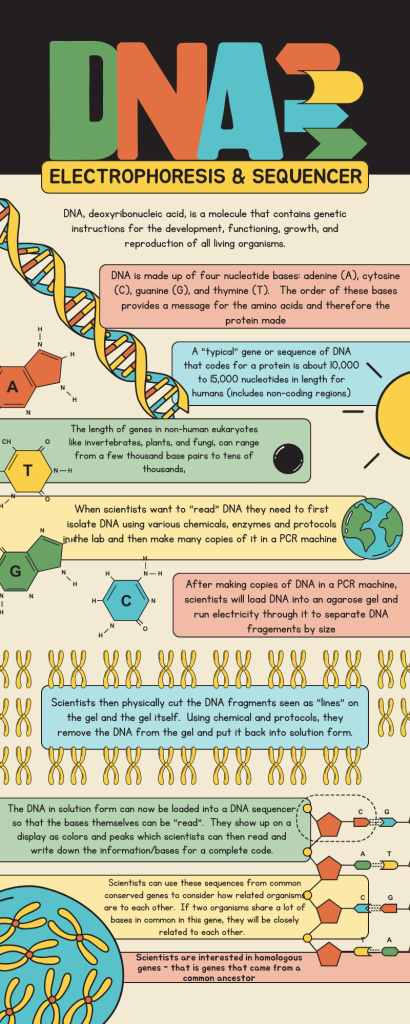
When scientists extract DNA from the cells of organisms, they can amplify it with the use of DNA technology. This means that they can take DNA and make many copies of it quickly using an instrument called a thermocycler. They can use various protocols to label DNA, cut it into fragments, and then load it into an agarose gel. The gel is a bit like jello in consistency and has “wells” in it or indentations for the solution of DNA to be loaded. After scientists load this DNA into the wells that are submerged in a solution, electricity push the DNA fragments through the gel. Smaller fragments of DNA will move more quickly through a gel than longer ones so that when the electricity is turned off and the gel is stained, you can see fragments of DNA as lines on the gel (Fig 5).

Figure 5: A sample DNA gel. After running the gel, you can see different-sized fragments on this gel. The larger fragments, 2000 bp (base pairs), are found near the top of the gel, and the smaller fragments, 250 bp, near the bottom. From Shinryuu, Public domain, via Wikimedia Commons at https://commons.wikimedia.org/wiki/File:Apoptotic_DNA_Laddering.png
The goal is to use these fragments to generate the sequence of bases and the code of DNA. Watch this short video to gain a perspective on this.
Scientists can then cut the DNA fragments of interest out of the gel and using various procedures, return the DNA into a solution. Once back into solution, scientists can run it through an instrument called a DNA sequencing machine. The instrument will “read” the DNA with a laser which lights up the labeled DNA so that different colors represent different bases of DNA. For example, the base adenine or “A” is seen as a green peak, while the base thymine or “T” is seen in red (Fig 6).
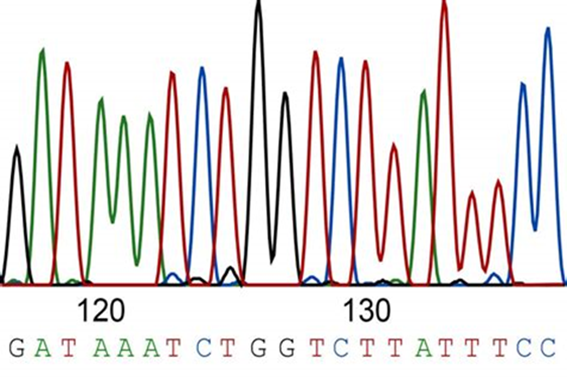
Figure 6: A sample illustration of what part of a DNA sequence would look like after being run through a DNA sequencer. The different colored peaks represent a different base, which corresponds to the sequence seen above: GATAAATCTGGTCTTATTTCC.
Fred Sanger developed the sequencing method used for the human genome sequencing project, which is widely used today. The sequencing method is known as the dideoxy chain termination method. Building off of what was described above, his method is based on the use of chain terminators, the dideoxynucleotides (ddNTPs). The ddNTPSs differ from the deoxynucleotides by the lack of a free 3′ OH group on the five-carbon sugar. If a ddNTP is added to a growing DNA strand, the chain cannot be extended any further because the free 3′ OH group needed to add another nucleotide is not available. By using a predetermined ratio of deoxynucleotides to dideoxynucleotides, it is possible to generate DNA fragments of different sizes.
The DNA sample to be sequenced is denatured (separated into two strands by heating it to high temperatures). The DNA is divided into four tubes in which a primer, DNA polymerase (an enzyme to help copy the DNA to make more DNA strands), and all four nucleoside triphosphates (A, T, G, and C) are added. In addition, limited quantities of one of the four dideoxynucleoside triphosphates (ddCTP, ddATP, ddGTP, and ddTTP) are added to each tube respectively. The tubes are labeled as A, T, G, and C according to the ddNTP added. For detection purposes, each of the four dideoxynucleotides carries a different fluorescent label. Chain elongation continues until a fluorescent dideoxy nucleotide is incorporated, after which no further elongation takes place. After the reaction is over, electrophoresis is performed. Even a difference in the length of a single base can be detected. The sequence is read from a laser scanner that detects the fluorescent marker of each fragment (Fig 7). For his work on DNA sequencing, Sanger received a Nobel Prize in Chemistry in 1980.
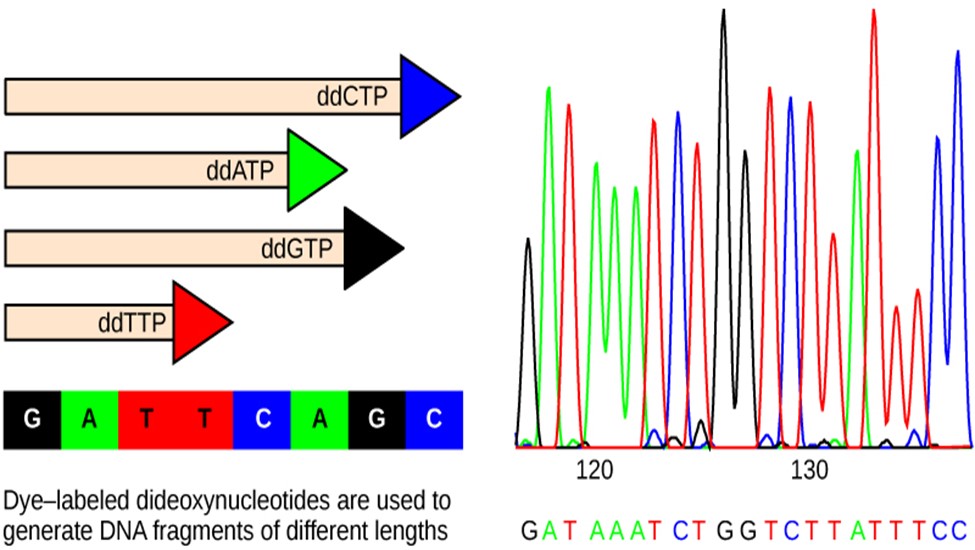
Figure 7: In Frederick Sanger’s dideoxy chain termination method, dye-labeled dideoxynucleotides are used to generate DNA fragments that terminate at different points. The DNA is separated by capillary electrophoresis (not defined) based on size, and from the order of fragments formed, the DNA sequence can be read. The DNA sequence readout is shown on an electropherogram (not defined) that is generated by a laser scanner.
This short video gives a quick overview of the methodology that goes into DNA sequencing using the Sanger method.
This will allow scientists to be able to sequence the exact coding of a DNA fragment, a gene, or a chromosome. These data can be studied between different organisms to see how much DNA they have in common with one another. For example, scientists can isolate the enzyme cytochrome oxidase and sequence it. Cytochrome is an example of a conserved gene, which means it has changed little over evolutionary time. The protein cytochrome c (cyt c) is about 100 amino acids long and is involved with aerobic respiration (it is found in the mitochondria) to help make ATP energy. Because of its value, we expect most species to have cytochrome and that it will be similar in terms of amino acids or DNA; however, there are some differences, and this is what can help us understand phylogeny. If there are more differences, you expect less relationship between species. In other words, the fewer differences you find, the more closely related you expect the species to be to one another.
Take a look at the image below (Fig 8). It illustrates samples taken from different organisms where cytochrome is isolated and sequenced. You will notice that colors match up in columns showing no changes. For example, the second position or base for these organisms is blue indicating “cytosine” or “C”. It is the same for all organisms. If you examine the fourth position, however, you will see mostly cytosine; however, there are two organisms (#4 & #5) that now have a red “tyrosine” or “T” base. This shows us a difference or a change in these organisms from their evolutionary past.
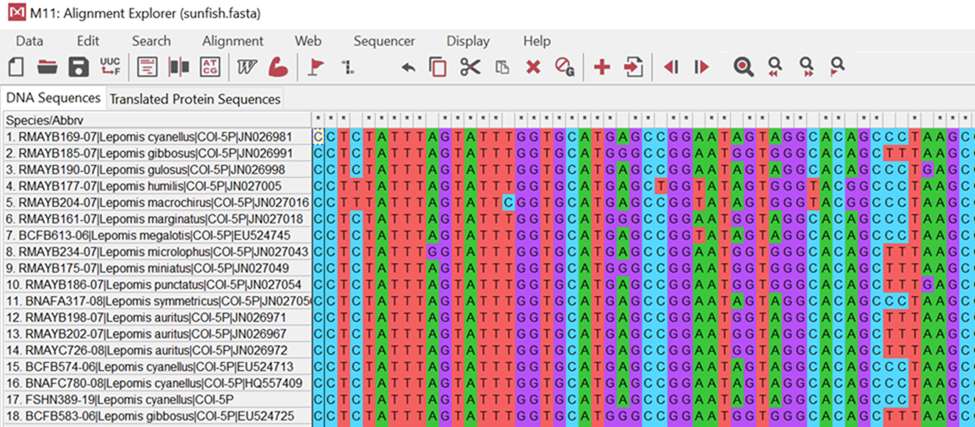
Figure 8: The DNA sequences of fish using the MEGA software program. This example shows you part of the aligned DNA sequences from a cytochrome oxidase gene. Individuals that are more closely related to one another should have more DNA in common.
Constructing Evolutionary Trees
How do scientists construct phylogenetic trees? After they sort the homologous and analogous traits, which could be DNA sequences or physical phenotypes (or both), scientists often organize the homologous traits using cladistics. This system sorts organisms into clades: groups of organisms that descended from a single ancestor. In cladistics, scientists often use molecular data to understand relationships, but they may also use the physical traits they can see as well. For example, in Figure 9, all the organisms in the orange region evolved from a single ancestor that had amniotic eggs. Amniotic eggs are an adaptation to life on land. These eggs contain different components to help the embryo deal with developing in an egg that is laid on land, rather than in the water. These eggs contain an amnion, which is a fluid that surrounds the embryo and protects it while it grows. The eggs also contain yolk to help nourish the developing embryo, a chorion to help with gas exchange and an allantois sac to hold waste. Consequently, these organisms with amniotic eggs make a single clade or a monophyletic group. Clades must include all descendants from a branch point.
The monophyletic group is the “ideal” type of cladogram because it will contain the ancestor and every single descendant species. There are no missing species and no gaps. Every piece of the puzzle is present.
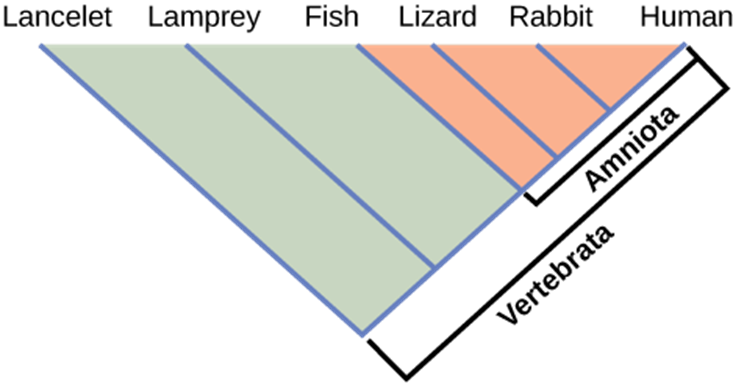
Figure 9: Lizards, rabbits, and humans all descend from a common ancestor that had an amniotic egg. Thus, lizards, rabbits, and humans all belong to the clade Amniota. Vertebrata is a larger clade that also includes fish and lamprey.
Clades can vary in size depending on which branch point one references. The important factor is that all organisms in the clade or monophyletic group stem from a single point on the tree. You can remember this because monophyletic breaks down into “mono,” meaning one, and “phyletic,” meaning evolutionary relationship. Figure 10 shows various clade examples. Notice how each clade comes from a single point; whereas, the non-clade groups show branches that do not share a single point.
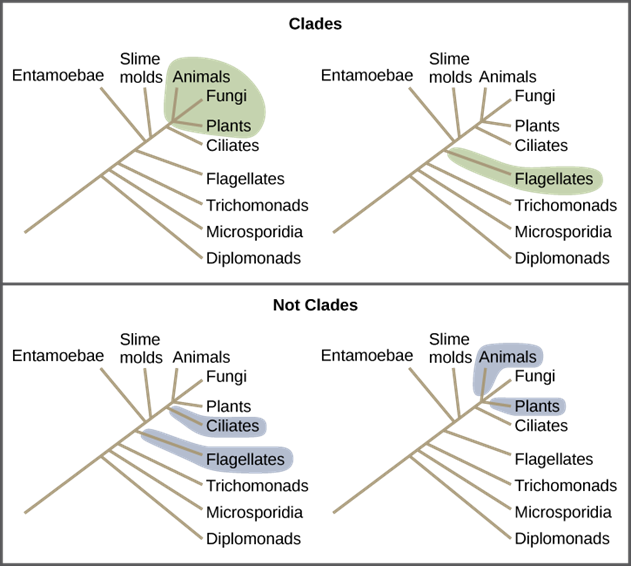
Figure 10: All the organisms within a clade stem from a single point on the tree. A clade may contain multiple groups, as in the case of animals, fungi, and plants, or a single group, as in the case of flagellates. Groups that diverge at a different branch point, or that do not include all groups in a single branch point, are not clades.
In addition to monophyletic groups, there are also paraphyletic and polyphyletic trees (Fig. 11).
Paraphyletic groups result when the ancestor species is known and some of the descendant species, but not all. There are some missing species. You will still be able to get a great sense of the clade, just like you would if you put together a puzzle with just a few missing pieces.
A polyphyletic group does not include the most recent common ancestor of all members of the group. Instead, you will find more than one ancestor (“poly” for many) feeding into the different species in question.
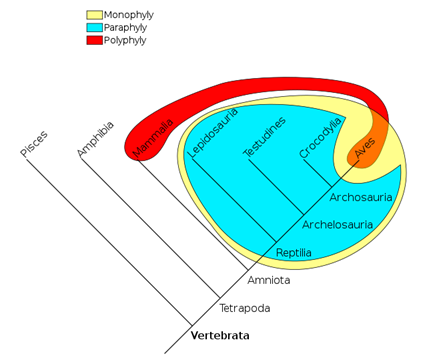
Figure 11: The three different types of cladograms you will find. The yellow group is monophyletic, meaning one ancestor and all of its descendants. The blue group is leaving off one descendent (the Aves) and therefore a piece is missing – this is a paraphyletic group. The red group, polyphyletic, shows 2 different ancestors and as such you will find that the most recent common ancestor to all members is not shown. Toto Baggins at English Wikipedia.
As such, a phylogenetic tree can be read like a map of evolutionary history. Many phylogenetic trees have a single lineage at the base representing a common ancestor. Scientists call such trees rooted, which means there is a single ancestral lineage (typically drawn from the bottom or left) to which all organisms represented in the diagram relate (Fig 12). Notice in the rooted phylogenetic tree that the three domains— Bacteria, Archaea, and Eukarya—diverge from a single point and branch off. The small branch that plants and animals (including humans) occupy in this diagram shows how recent and minuscule these groups are compared with other organisms. Unrooted trees don’t show a common ancestor but do show relationships among species (Fig 12).

Figure 12: Both of these phylogenetic trees show the relationship of the three domains of life—Bacteria, Archaea, and Eukarya—but the (a) rooted tree attempts to identify when various species diverged from a common ancestor while the (b) unrooted tree does not. (credit a: modification of work by Eric Gaba. “three domains of life” by OpenStax is licensed under CC BY 4.0)
In a rooted tree, the branching indicates evolutionary relationships (Fig 13). The point where a split occurs, called a branch point, represents where a single lineage evolved into a distinct new one. A lineage that evolved early from the root and remains unbranched is called basal taxon. When two lineages stem from the same branch point, they are called sister taxa. A branch with more than two lineages is called a polytomy and serves to illustrate where scientists have not definitively determined all of the relationships. It is important to note that although sister taxa and polytomy do share an ancestor, it does not mean that the groups of organisms split or evolved from each other. Organisms in two taxa may have split apart at a specific branch point, but neither taxa gave rise to the other.

Figure 13: The root of a phylogenetic tree indicates that an ancestral lineage gave rise to all organisms on the tree. A branch point indicates where two lineages diverged. A lineage that evolved early and remains unbranched is a basal taxon. When two lineages stem from the same branch point, they are sister taxa. A branch with more than two lineages is a polytomy. (credit: “rooted phylogenetic tree” by OpenStax is licensed under CC BY 4.0)
The diagrams above can serve as a pathway to understanding evolutionary history. The pathway can be traced from the origin of life to any individual species by navigating through the evolutionary branches between the two points. Also, by starting with a single species and tracing back towards the “trunk” of the tree, one can discover that species’ ancestors, as well as where lineages share a common ancestry. In addition, the tree can be used to study entire groups of organisms.
Another point to mention on phylogenetic tree structure is that rotation at branch points does not change the information. For example, if a branch point was rotated and the taxon order changed, this would not alter the information because the evolution of each taxon from the branch point was independent of the other.
Many disciplines within the study of biology contribute to understanding how past and present life evolved; these disciplines together contribute to building, updating, and maintaining the “tree of life.” Information is used to organize and classify organisms based on evolutionary relationships in a scientific field called systematics. Data may be collected from fossils, from studying the structure of body parts or molecules used by an organism, and by DNA analysis. By combining data from many sources, scientists can put together the phylogeny of an organism; since phylogenetic trees are hypotheses, they will continue to change as new types of life are discovered and new information is learned.
Shared Characteristics
Organisms evolve from common ancestors and then diversify. Scientists use the phrase “descent with modification” because even though related organisms have many of the same characteristics and genetic codes, changes occur. This pattern repeats as one goes through the phylogenetic tree of life:
- A change in an organism’s genetic makeup leads to a new trait that becomes prevalent in the group.
- Many organisms descend from this point and have this trait.
- New variations continue to arise: some are adaptive and persist, leading to new traits.
- With new traits, a new branch point is determined (go back to step 1 and repeat).
If a characteristic is found in the ancestor of a group, it is considered a shared ancestral character because all of the organisms in the taxon or clade have that trait. The vertebrate in Figure 9 is a shared ancestral character. Now consider the amniotic egg characteristic in the same figure. Only some of the organisms in Figure 9 have this trait, and to those that do, it is called a shared derived character because this trait is derived at some point but does not include all of the ancestors in the tree.
Derived traits are sometimes called advanced traits. The reference is to time, not complexity. Therefore, advanced traits are younger traits compared to older, primitive traits. Again, primitive does not mean simple, instead primitive is about time. Primitive traits have been around for a long evolutionary time and are sometimes called ancestral traits. We find these traits associated with ancestor species.
Limitations of Phylogenetics Trees
It may be easy to assume that more closely related organisms look more alike, and while this is often the case, it is not always true. If two closely related lineages evolved under significantly varied surroundings or after the evolution of a major new adaptation, the two groups can appear more different than other groups that are not as closely related. For example, the phylogenetic tree in Figure 14 shows that lizards and rabbits both have amniotic eggs, whereas frogs do not; yet lizards and frogs appear more similar than lizards and rabbits.
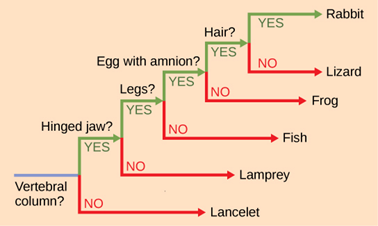
Figure 14: This ladder-like phylogenetic tree of vertebrates is rooted in an organism that lacked a vertebral column. At each branch point, organisms with different characters are placed in different groups based on the characteristics they share. (credit: “ladder-like phylogenetic tree” by OpenStax is licensed under CC BY 4.0)
Another aspect of phylogenetic trees is that, unless otherwise indicated, the branches do not account for length of time, only the evolutionary order. In other words, the length of a branch does not typically mean more time passed, nor does a short branch mean less time passed— unless specified on the diagram. For example, in Figure 14, the tree does not indicate how much time passed between the evolution of amniotic eggs and hair. What the tree does show is the order in which things took place. Again using Figure 14 above, the tree shows that the oldest trait is the vertebral column, followed by hinged jaws, and so forth. Remember that any phylogenetic tree is a part of the greater whole, and like a real tree, it does not grow in only one direction after a new branch develops. So, for the organisms in Figure 14, just because a vertebral column evolved does not mean that invertebrate evolution ceased, it only means that a new branch formed. Also, groups that are not closely related, but evolve under similar conditions, may appear more phenotypically similar to each other than to a close relative.
Choosing the Right Relationships
Organizing the evolutionary relationships of all life on Earth proves difficult: scientists must span enormous blocks of time and work with information from long-extinct organisms. Trying to decipher the proper connections, especially given the presence of homologies and analogies, makes the task of building an accurate tree of life extraordinarily difficult. Add to that advancing DNA technology, which now provides large quantities of genetic sequences for researchers to use and analyze. Taxonomy, the branch of science concerned with the classification of organisms, is a subjective discipline in some ways: many organisms have more than one connection to each other, so each taxonomist will decide the order of connections. These relationships can change as more data are gathered and technology changes to highlight previously unknown information.
To help build an evolutionary tree, scientists will use an outgroup species as a reference group. The outgroup consists of a species that is related to the species being studying, but not too closely related (Fig 15). For example, if you are studying several species that are amniotes, you could use an amphibian as an outgroup. This species is a vertebrate and has connections to land (so there is some relation there, but does not lay amniotic eggs). Scientists would use this species as the outgroup and reference it as the oldest. From there we could compare the other species to and decide how closely or distantly related it is to the outgroup. This will help determine placement on the cladogram.
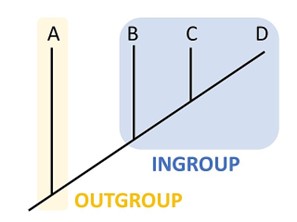
Figure 15: An outgroup, like species A, is used by scientists as a reference group. Scientists can compare species B, C, and D to A to determine placement on the cladogram. Species D must have fewer traits in common with the outgroup which is why it is placed the furthest away and therefore the youngest. Ngilbert202, CC BY-SA 4.0 <https://creativecommons.org/licenses/by-sa/4.0>, via Wikimedia Commons at https://commons.wikimedia.org/wiki/File:Outgroup.jpg
To aid in the tremendous task of describing phylogenies accurately, scientists often use the concept of maximum parsimony, which means that events occur in the simplest, most obvious way. For example, if a group of people entered a forest preserve to hike, based on the principle of maximum parsimony, one could predict that most would hike on the established trail that had the most direct route to the waterfall (end goal) rather than creating new paths in the forest or moving from one path to another before getting to the waterfall. This would take more energy and the complexity would not be favored. The idea with maximum parsimony is to “go with the most simple explanation.” That relationship description will represent the most probable hypothesis.
For scientists deciphering evolutionary pathways, the pathway of evolution probably includes the fewest major events that coincide with the evidence at hand. Starting with all of the homologous traits in a group of organisms, scientists look for the most obvious and simple order of evolutionary events that led to the occurrence of those traits.
To learn more about how researchers use maximum parsimony to create phylogenetic trees, click here.
In the following example, notice two evolutionary trees were created, representing Hypothesis 1 and Hypothesis 2 (Fig 16). Notice that Hypothesis 1 shows 6 novel changes indicated by the red bars. Hypothesis 2 shows 7 changes. Based on maximum parsimony, the better hypothesis to describe the relationship between these species would be Hypothesis 1.
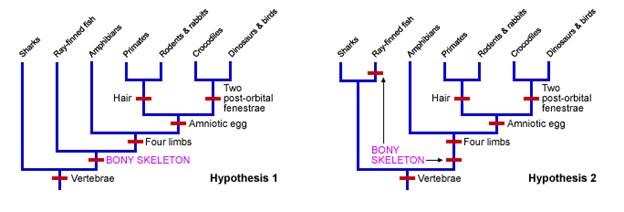
Figure 16: Two hypotheses are shown visually for the relationship between 7 groups of organisms. Because the evolutionary tree on the left uses fewer changes, we would choose this as the best hypothesis to explain the relationship between these animals.
Potential Problems and Confusion with Cladograms
As discussed above, the goal is to find the ancestor and all the descendants (monophyletic clade) with the most simple pathway (parsimony). The traits that all the descendants share would be homologous, coming from that ancestor. In cladistics, you might hear the term synapomorphy to describe a derived character shared by members of a clade. These traits and the monophyletic grouping are the goals when building cladograms. You may also hear the term plesiomorphy which is a primitive trait that has stuck around over evolutionary time and you see it with all the members of the clade. The ancestor had the traits and all the descendants do too. Plesiomophies do not change over evolutionary time, but the synapomorphies have changed from the ancestor.
If a scientist mistakes a trait as homologous when it is actually analogous, they will get the wrong “answer” and make a mistake about who is closely related to whom. Remember these analogous traits come from the same selective pressure in the environment, not from the same ancestor. Another way of stating this is to say that convergent evolution carved out the analogous traits. Convergent evolution is the independent development of similar structures in organisms that are not directly related but are found instead due to similar selective pressures in their environment.
Another term you may hear associated with convergent evolution is homoplasy or homoplastic traits. This term, homoplasy, is used in cladistics to describe the shared character state that has not been inherited from a common ancestor exhibition of that state. The goal is to NOT have these traits on our evolutionary trees as it will give us the wrong information about who is closely related to whom.
If scientists are looking at the molecular data of species, there is also potential for confusion. The goal is to find DNA sequences (or the proteins they code for) of different species and compare them to one another. The DNA sequences would need to be from comparable chromosomes (recall the cytochrome c discussion above). The assumption is that if more DNA is shared between species, they are more closely related.
The problem comes when we consider how genes evolve and how DNA changes over time. Sometimes genes (sections of DNA) can be copied and duplicated. Sometimes these new duplicated sections do not do anything (e.g. they may become a non-functional pseudogene, which is a DNA sequence that resembles a gene but has mutated into an inactive form over time) and sometimes they can contribute to changes in the organisms. Let’s say we are comparing the DNA of three organisms together and we will summarize the base sequences as “A”. So instead of writing the whole code of bases like TTCGCAATTGGCAGACT, we will summarize it as “A”. If one species has “A” and another has a duplicated sequence of “AA”, and the third species has “AA” what does this mean?
We need to know something about the location of these duplicated genes. Is the second “A” right next to the first? Is the second “A” on a different chromosome? Is the second “A” from a duplicated event or not or did it stem from an ancestor?
If we assume the species with only one “A” is the oldest, we can look at the other two to gain some clues about the relationship. If one of the “AA” species has a copy of the DNA in the same place compared to the oldest species, we would say these are orthologs. Another way to state this is to say that orthologs are genes that reflect the conservation of a single gene found in an ancestor.
If instead the second “A” is in a different place compared to the oldest species, we would say these sequences are paralogs to each other. A paralog can arise from a duplication event with the same genome and NOT be passed down from an ancestor.
Another way to consider this is to state that orthologous genes stem from a common ancestor (and you would find in two or more species), whereas paralogous genes tend to arise from a duplication event (and you would find in one species; Fig 17).
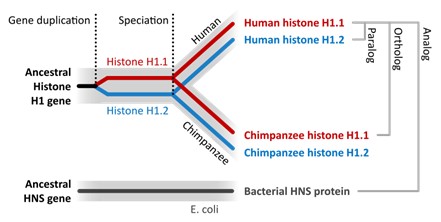
Figure 17: Human histone gene H1.1 and Chimpanzee histone H1.1 are shown in red stem from an ancestor (ancestral histone H1 gene) and are found in the same place on their respective chromosome – therefore they are orthogonal to each other. On the other hand, if we compare human histone H1.1 to human histone H1.2 to one another, H1.2 is from a duplication event of H1.1 and therefore, these genes are paralogs to each other (they are found in different places). Thomas Shafee, CC BY 4.0 via Wikimedia Commons.
If a scientist is examining DNA sequences and sees the same sequences in species “A” vs “A”, if they incorrectly think the second “A” is from an ancestor and therefore an ortholog when it is NOT (i.e. it is really a paralog), they will incorrectly think the species are more closely related to each other than they are. This is why you might get an incorrect evolutionary tree construct.
In general, it is important to gather as much data as possible. As with all science, the more data you have, the less biased and more reliable your data becomes. This will allow scientists to construct the most reliable hypothesis for the evolutionary trees possible.
Summary
Phylogeny, the evolutionary history, and relationships among species, is of paramount importance in the field of biology. It provides valuable insights into the origin, diversification, and interconnections of life on Earth. Scientists use phylogeny as a foundational tool to study species in various ways, unraveling the complex tapestry of life’s history and understanding the processes that have shaped it.
Key reasons for the importance of phylogeny:
- Understanding Evolutionary History: Phylogeny allows us to trace the lineage and ancestry of species over time, revealing how they have evolved and adapted to changing environments. It provides a comprehensive framework for understanding the evolutionary transitions, innovations, and extinctions that have occurred throughout Earth’s history.
- Biodiversity Conservation: By understanding the evolutionary relationships among species, scientists can identify key species for conservation efforts. Phylogenetic analyses help prioritize which species are most vulnerable and ecologically important, aiding in the protection of biodiversity and ecosystems.
- Predicting Traits and Behaviors: Phylogenetic trees can provide insights into the traits, behaviors, and adaptations that evolved in specific lineages. By studying related species, scientists can make educated predictions about the characteristics of organisms, helping to uncover functional and ecological aspects of different species.
- Medical and Drug Discovery: Phylogeny aids in studying the evolutionary history of pathogens, such as viruses and bacteria, which can inform the development of treatments and vaccines. Understanding the evolutionary relationships of these organisms helps scientists predict how they might evolve and spread in the future.
- Comparative Studies: Phylogenetic analyses allow scientists to compare traits and genetic information across different species. By examining similarities and differences, researchers can gain insights into the mechanisms behind traits, behaviors, and diseases, contributing to fields like physiology, genetics, and medicine.
- Biogeography: Studying the distribution of species across geographic regions can provide clues about how continents and ecosystems have changed over time. Phylogenetic analyses help explain patterns of species distribution and migration, contributing to our understanding of Earth’s geological history.
Scientists utilize both morphological (physical characteristics) and molecular (genetic) data to construct evolutionary trees or cladograms, visual representations that depict the evolutionary relationships between species. These approaches offer complementary insights, allowing researchers to create more accurate and comprehensive depictions of evolutionary history. Scientists analyze the physical traits and structures of different species. Similarities and differences in features such as bone structure, skeletal elements, organs, and body shape provide clues about evolutionary relationships. Shared traits (homologies) are indicative of common ancestry, while differences (analogies) might suggest convergent evolution. Scientists also use genetic data, particularly DNA sequences, to study evolutionary relationships. Scientists compare the genetic code of different species, focusing on specific genes or regions that are conserved across organisms. Similarities in DNA sequences indicate shared ancestry.
Both morphological and molecular data play crucial roles in building accurate evolutionary trees or cladograms. These methods allow scientists to piece together the puzzle of life’s history, uncovering the connections and patterns that have shaped the diversity of species on Earth.
Questions
Glossary
References
Bartee, L, Shriner, W, and C Creech. Reading phylogenetic trees and limitations of trees. Principles of Biology.
Clark, MA, Choi, J, and M Douglas. Biology 2e for Biol 11 and Biol 112.
Kosal, E. 2023. Molecular Comparisons & Potential Problems and Confusion with Cladograms. NC State University.
