
6.9 Describing a Reaction: Energy Diagrams and Transition States
For a reaction to take place, reactant molecules must collide and reorganization of atoms and bonds must occur. Let’s again look at the addition reaction of HBr and ethylene.
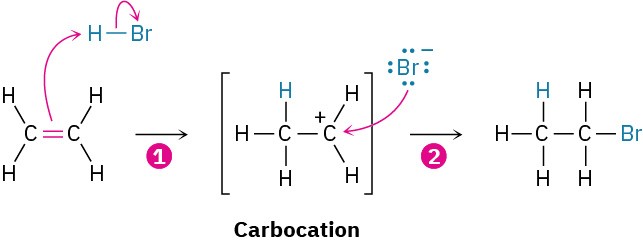
As the reaction proceeds, ethylene and HBr approach each other, the ethylene π bond and the H−Br bond break, a new C−H bond forms in step 1 and a new C−Br bond forms in step 2.
To depict graphically the energy changes that occur during a reaction, chemists use energy diagrams, such as that in Figure 6.5. The vertical axis of the diagram represents the total energy of all reactants, and the horizontal axis, called the reaction coordinate, represents the progress of the reaction from beginning to end. Let’s see how the addition of HBr to ethylene can be described in an energy diagram.
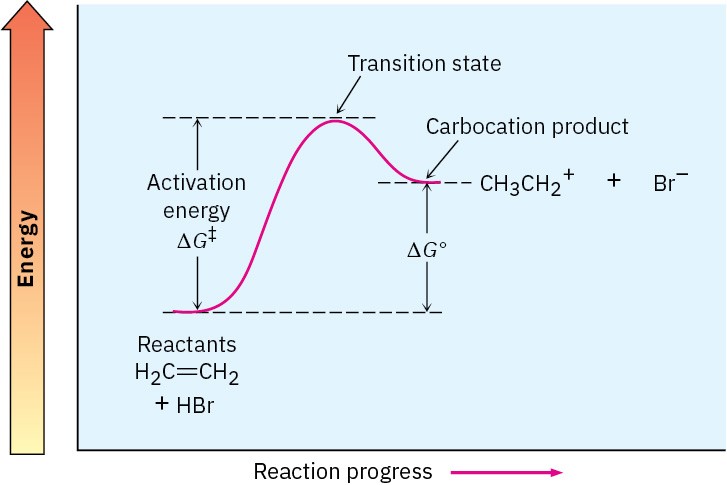
Figure 6.5 An energy diagram for the first step in the reaction of ethylene with HBr. The energy difference between reactants and the transition state, ΔG‡, defines the reaction rate. The energy difference between reactants and carbocation product, ΔG°, defines the position of the equilibrium.
At the beginning of the reaction, ethylene and HBr have the total amount of energy indicated by the reactant level on the left side of the diagram in Figure 6.5. As the two reactants collide and reaction commences, their electron clouds repel each other, causing the energy level to rise. If the collision has occurred with enough force and proper
orientation, however, the reactants continue to approach each other despite the rising repulsion until the new C−H bond starts to form. At some point, a structure of maximum energy is reached, a structure called the transition state.
The transition state represents the highest-energy structure involved in this step of the reaction. It is unstable and can’t be isolated, but we can imagine it to be an activated complex of the two reactants in which both the C═C π bond and H−Br bond are partially broken and the new C−H bond is partially formed (Figure 6.6).
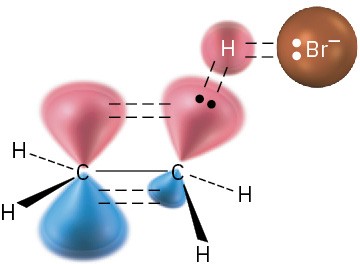
Figure 6.6 A hypothetical transition-state structure for the first step of the reaction of ethylene with HBr. The C═C π bond and H−Br bond are just beginning to break, and the C−H bond is just beginning to form.
The energy difference between reactants and the transition state is called the activation energy, ΔG‡, and determines how rapidly the reaction occurs at a given temperature. (The double-dagger superscript, ‡, always refers to the transition state.) A high activation energy results in a slow reaction because few collisions occur with enough energy for the reactants to reach the transition state. A low activation energy results in a rapid reaction because almost all collisions occur with enough energy for the reactants to reach the transition state.
As an analogy, you might think of reactants that need enough energy to climb the activation barrier to the transition state as hikers who need enough energy to climb to the top of a mountain pass. If the pass is a high one, the hikers need a lot of energy and surmount the barrier with difficulty. If the pass is low, the hikers need less energy and reach the top easily.
As a rough generalization, many organic reactions have activation energies in the range 40 to 150 kJ/mol (10–35 kcal/mol). The reaction of ethylene with HBr, for example, has an activation energy of approximately 140 kJ/mol (34 kcal/mol). Reactions with activation energies less than 80 kJ/mol take place at or below room temperature, while reactions with higher activation energies normally require a higher temperature to give the reactants enough energy to climb the activation barrier.
Once the transition state is reached, the reaction can either continue on to give the carbocation product or revert back to reactants. When reversion to reactants occurs, the transition-state structure comes apart and an amount of free energy corresponding to −ΔG‡ is released. When the reaction continues on to give the carbocation, the new C−H bond forms fully and an amount of energy is released corresponding to the difference between the transition state and carbocation product. The net energy change for the step, ∆G°, is
represented in the diagram as the difference in level between reactant and product. Since the carbocation is higher in energy than the starting alkene, the step is endergonic, has a positive value of ∆G°, and absorbs energy.
Not all energy diagrams are like that shown for the reaction of ethylene and HBr. Each reaction has its own energy profile. Some reactions are fast (small ΔG‡) and some are slow (large ΔG‡); some have a negative ΔG°, and some have a positive ΔG°. Figure 6.7 illustrates some different possibilities.
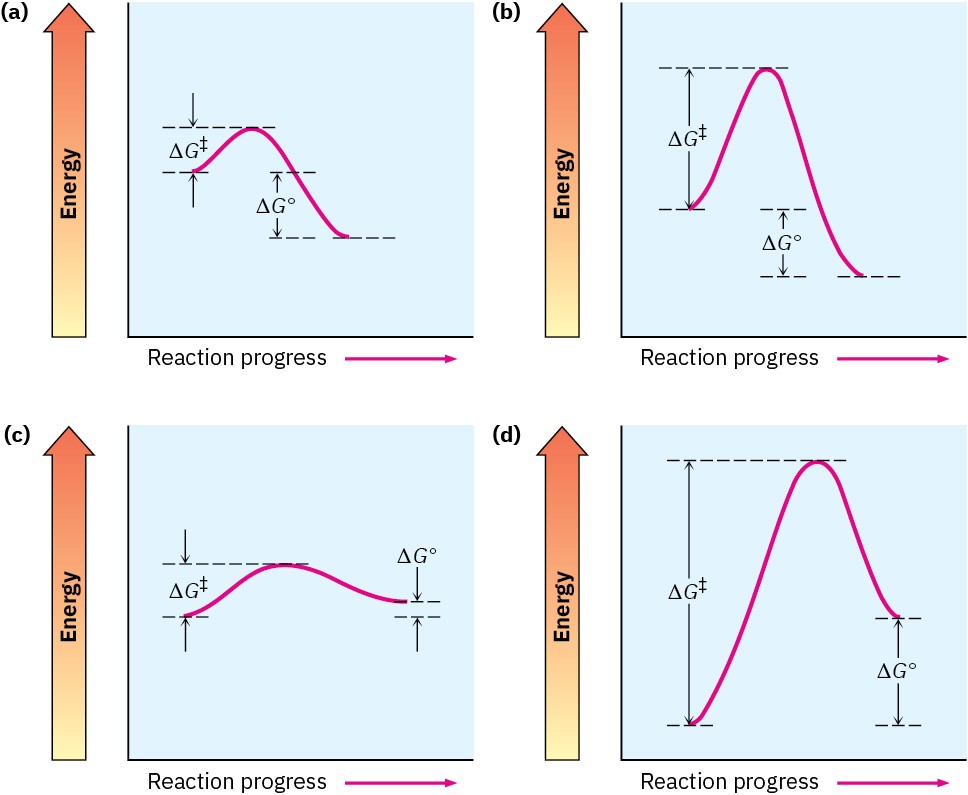
Figure 6.7 Some hypothetical energy diagrams: (a) a fast exergonic reaction (low ΔG‡, negative ΔG°); (b) a slow exergonic reaction (high ΔG‡, negative ΔG°); (c) a fast endergonic reaction (small ΔG‡, small positive ΔG°); (d) a slow endergonic reaction (high ΔG‡, positive ΔG°).
Problem 6-12
Which reaction is faster, one with ΔG‡ = +45 kJ/mol or one with ΔG‡ = +70 kJ/mol?
