12.6 Infrared Spectra of Some Common Functional Groups
As each functional group is discussed in future chapters, the spectroscopic properties of that group will be described. For the present, we’ll point out some distinguishing features of the hydrocarbon functional groups already studied and briefly preview some other common functional groups. We should also point out, however, that in addition to interpreting absorptions that are present in an IR spectrum, it’s also possible to get structural information by noticing which absorptions are not present. If the spectrum of a compound has no absorptions at 3300 and 2150 cm–1, the compound is not a terminal alkyne; if the spectrum has no absorption near 3400 cm–1, the compound is not an alcohol; and so on.
Alkanes
The IR spectrum of an alkane is fairly uninformative because no functional groups are present and all absorptions are due to C–H and C–C bonds. Alkane C–H bonds show a strong absorption from 2850 to 2960 cm–1, and saturated C–C bonds show a number of bands in the 800 to 1300 cm–1 range. Since most organic compounds contain saturated alkane-like portions, most organic compounds have these characteristic IR absorptions. The C–H and C–C bands are clearly visible in the three spectra shown previously in Figure 12.21.
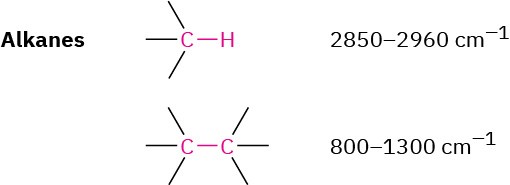
Alkenes
Alkenes show several characteristic stretching absorptions. Vinylic =C–H bonds absorb from 3020 to 3100 cm–1, and alkene C═C bonds usually absorb near 1650 cm–1, although in some cases their peaks can be rather small and difficult to see clearly when the alkene is symmetric, or nearly so. Both absorptions are visible in the 1-hexene spectrum in Figure 12.21b.
Alkenes have characteristic =C–H out-of-plane bending absorptions in the 700 to 1000 cm–1 range, thereby allowing the substitution pattern on a double bond to be determined (Figure 12.23). For example, monosubstituted alkenes such as 1-hexene show strong characteristic bands at 910 and 990 cm–1, and 1,1-disubstituted alkenes (R!C═CH!) have an intense band at 890 cm–1.
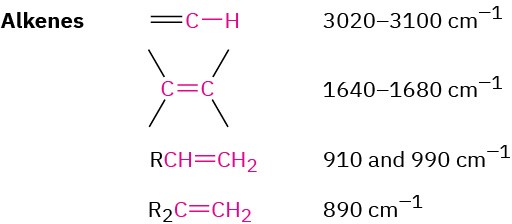
Figure 12.23C–H out-of-plane bending vibrations for substituted alkenes.
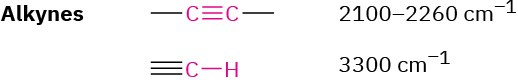
Alkynes
Alkynes show a C≡C stretching absorption at 2100 to 2260 cm–1, an absorption that is much more intense for terminal alkynes than for internal alkynes. Terminal alkynes such as 1-hexyne also have a characteristic ≡C–H stretching absorption at 3300 cm–1 (Figure 12.21c). This band is diagnostic for terminal alkynes because it is fairly intense and quite sharp.
Aromatic Compounds
Aromatic compounds, such as benzene, have a weak C–H stretching absorption at 3030 cm– 1, just to the left of a typical saturated C–H band. In addition, they have a series of weak absorptions in the 1660 to 2000 cm–1 range and a series of medium-intensity absorptions in the 1450 to 1600 cm–1 region. These latter absorptions are due to complex molecular motions of the entire ring. The C–H out-of-plane bending region for benzene derivatives, between 650 to 1000 cm–1, gives valuable information about the ring’s substitution pattern, as it does for the substitution pattern of alkenes (Figure 12.24).
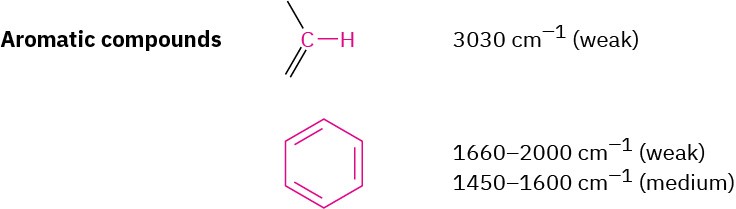
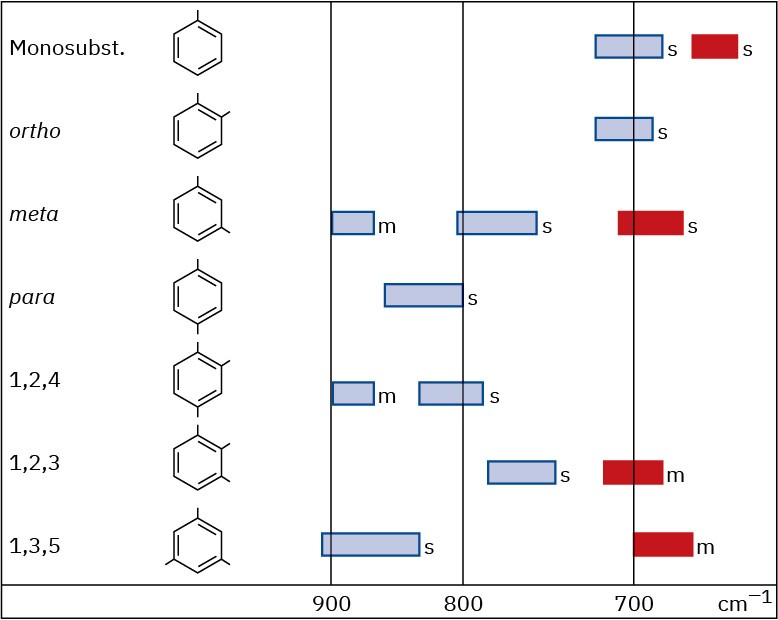
Figure 12.24C–H out-of-plane bending vibrations for substituted benzenes.
The IR spectrum of phenylacetylene, shown in Figure 12.29 at the end of this section, gives an example, clearly showing the following absorbances: ≡C–H stretch at 3300 cm–1, C–H stretches from the benzene ring at 3000 to 3100 cm–1, C═C stretches of the benzene ring between 1450 and 1600 cm–1, and out-of-plane bending of the ring’s C–H groups, indicating monosubstitution at 750 cm–1.
Alcohols
The O–H functional group of alcohols is easy to spot. Alcohols have a characteristic band in the range 3400 to 3650 cm–1 that is usually broad and intense. Hydrogen bonding between O–H groups is responsible for making the absorbance so broad. If an O–H stretch is present, it’s hard to miss this band or to confuse it with anything else.

Cyclohexanol (Figure 12.25) is a good example.
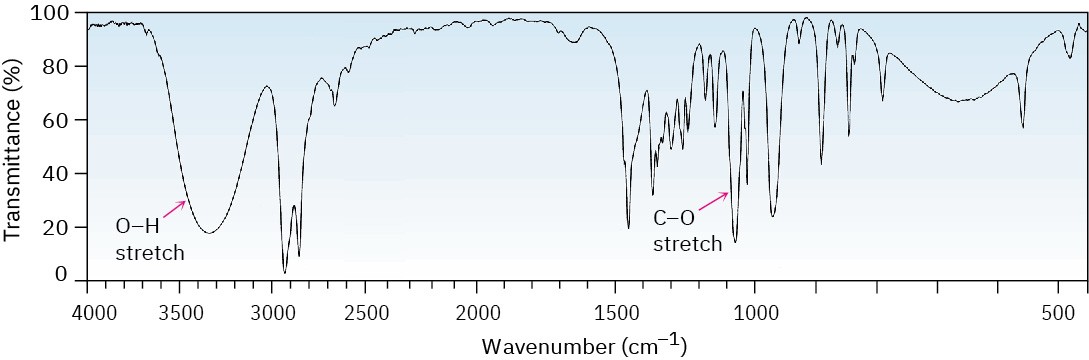
Figure 12.25IR spectrum of cyclohexanol.
Amines
The N–H functional group of amines is also easy to spot in the IR, with a characteristic absorption in the 3300 to 3500 cm–1 range. Although alcohols absorb in the same range, an N–H absorption band is much sharper and less intense than an O–H band.

Primary amines (R–NH2) have two absorbances—one for the symmetric stretching mode and one for the asymmetric mode (Figure 12.26). Secondary amines (R2N–H) only have one N–H stretching absorbance in this region.
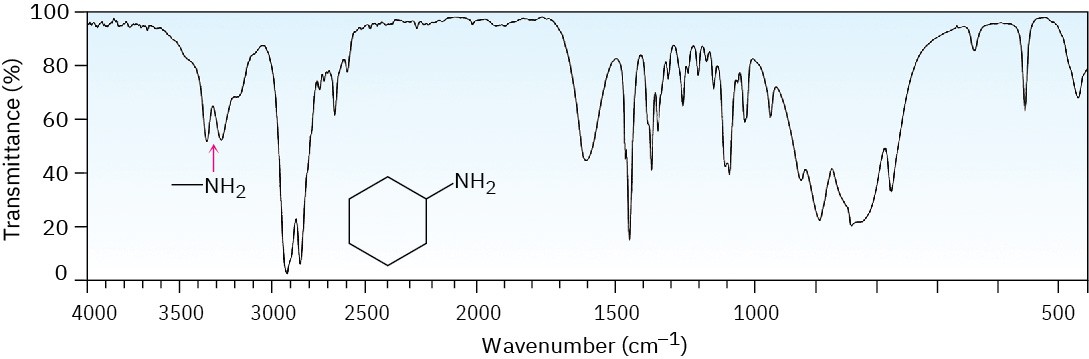
Figure 12.26IR spectrum of cyclohexylamine.
Carbonyl Compounds
Carbonyl functional groups are the easiest to identify of all IR absorptions because of their sharp, intense peak in the range 1670 to 1780 cm–1. Most important, the exact position of absorption within this range can often be used to identify the exact kind of carbonyl functional group—aldehyde, ketone, ester, and so forth.
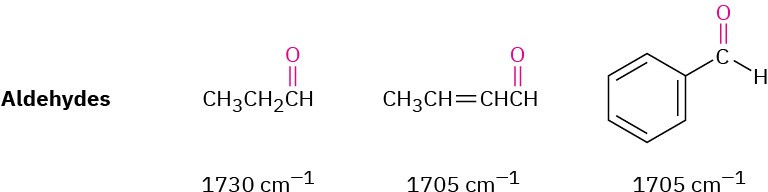
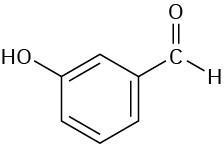
ALDEHYDES
Saturated aldehydes absorb at 1730 cm–1; aldehydes next to either a double bond or an aromatic ring absorb at 1705 cm–1.
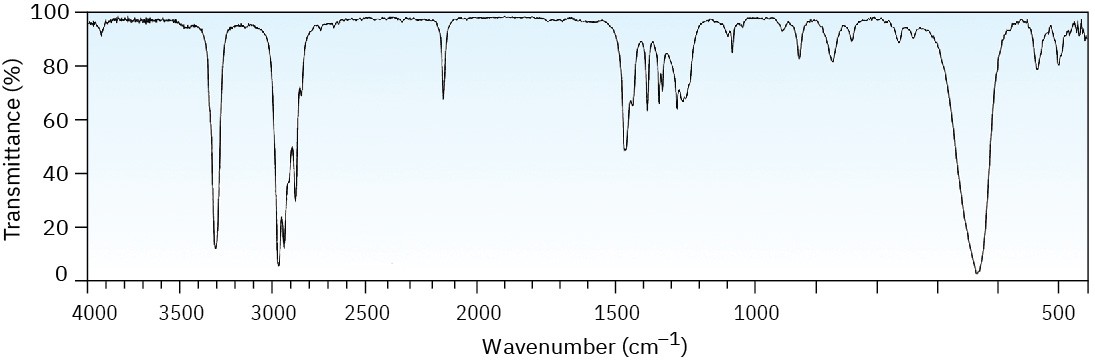
The C–H group attached to the carbonyl is responsible for the characteristic IR absorbance for aldehydes at 2750 and 2850 cm–1 (Figure 12.27). Although these are not very intense, the absorbance at 2750 cm–1 is helpful when trying to distinguish between an aldehyde and a ketone.
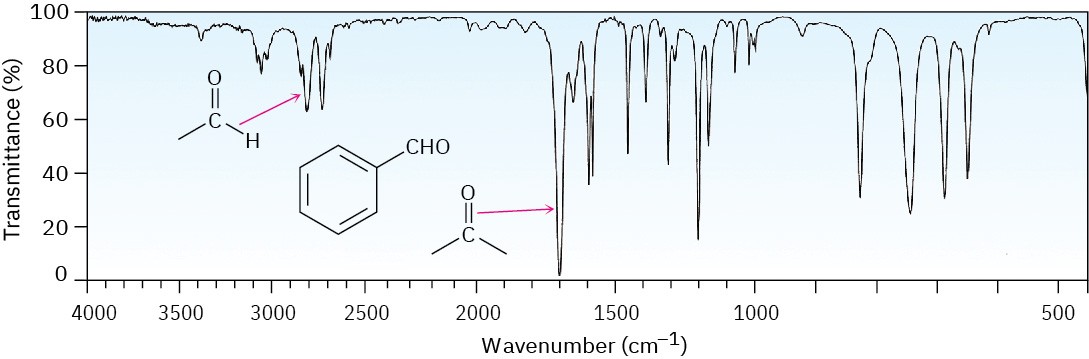
Figure 12.27The IR spectrum of benzaldehyde.
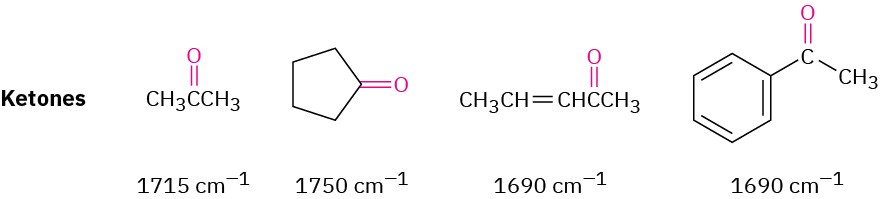
KETONES
Saturated open-chain ketones and six-membered cyclic ketones absorb at 1715 cm–1. Ring strain stiffens the C═O bond, making five-membered cyclic ketones absorb at 1750 cm–1 and four-membered cyclic ketones absorb at 1780 cm–1, about 20 to 30 cm–1 lower than the corresponding saturated ketone.
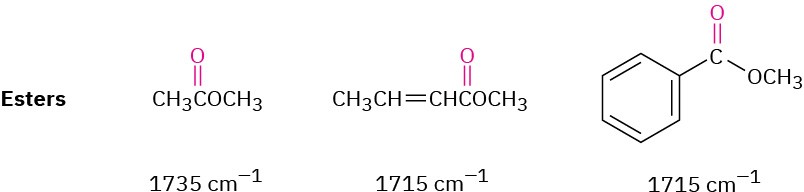
ESTERS
Saturated esters have a C═O absorbance at 1735 cm–1 and two strong absorbances in the 1300 to 1000 cm–1 range from the C–O portion of the functional group. Like other carbonyl functional groups, esters next to either an aromatic ring or a double bond absorb at 1715 cm–1, about 20 to 30 cm–1 lower than a saturated ester.
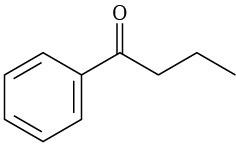
Worked Example 12.5Predicting IR Absorptions of CompoundsWhere might the following compounds have IR absorptions?
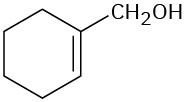
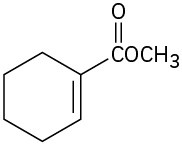
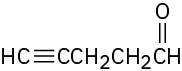
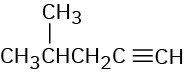
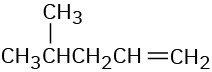
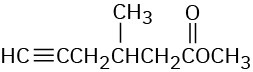 StrategyIdentify the functional groups in each molecule, and then check Table 12.1 to see where those groups absorb.Solution(a) Absorptions: 3400 to 3650 cm–1 (O–H), 3020 to 3100 cm–1 (=C–H), 1640 to 1680 cm–1 (C═C). This molecule has an alcohol O–H group and an alkene double bond.(b) Absorptions: 3300 cm–1 (≡C–H), 2100 to 2260 cm–1 (C≡C), 1735 cm–1 (C═O). This molecule has a terminal alkyne triple bond and a saturated ester carbonyl group.
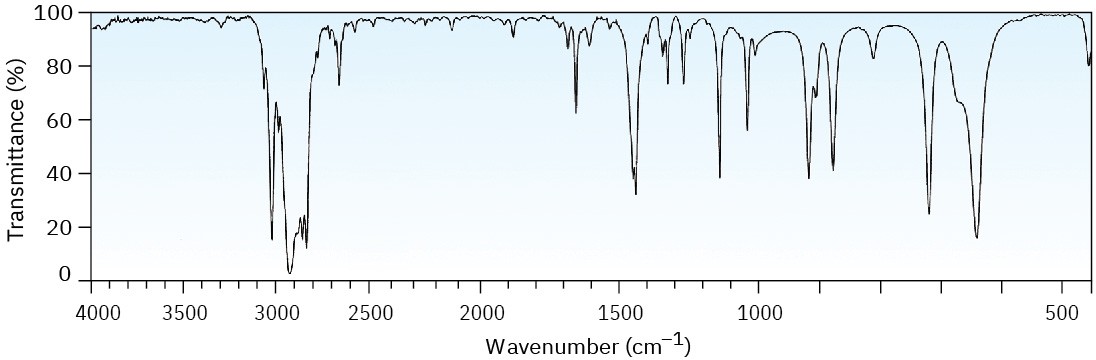
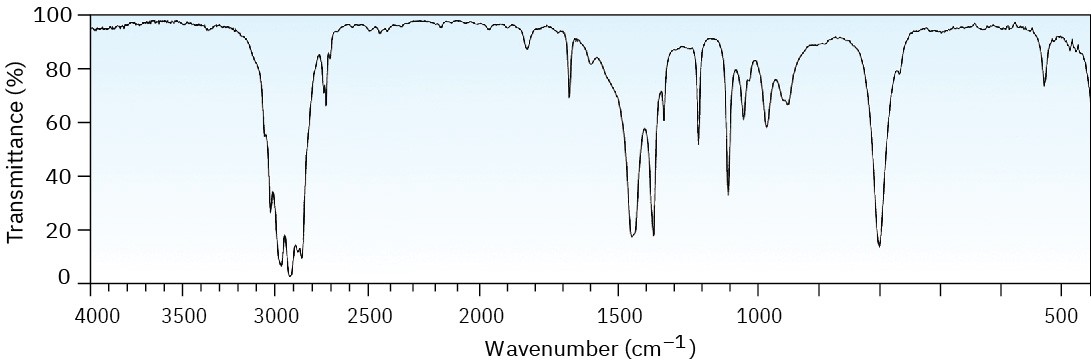
Worked Example 12.6Identifying Functional Groups from an IR SpectrumThe IR spectrum of an unknown compound is shown in Figure 12.28. What functional groups does the compound contain?
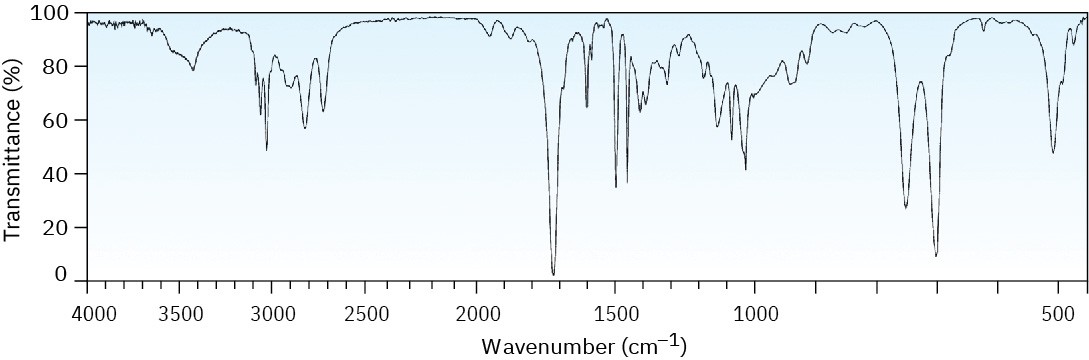
Figure 12.28IR spectrum for Worked Example 12.6.
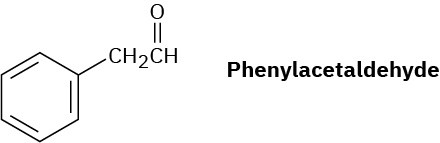
StrategyAll IR spectra have many absorptions, but those useful for identifying specific functional groups are usually found in the region from 1500 cm–1 to 3300 cm–1. Pay particular attention to the carbonyl region (1670 to 1780 cm–1), the aromatic region (1660 to 2000 cm–1), the triple-bond region (2000 to 2500 cm–1), and the C–H region (2500 to 3500 cm–1).SolutionThe spectrum shows an intense absorption at 1725 cm–1 due to a carbonyl group (perhaps an aldehyde, –CHO), a series of weak absorptions from 1800 to 2000 cm–1 characteristic of aromatic compounds, and a C–H absorption near 3030 cm–1, also characteristic of aromatic compounds. In fact, the compound is phenylacetaldehyde.
Problem 12-9
The IR spectrum of phenylacetylene is shown in Figure 12.29. What absorption bands can you identify?
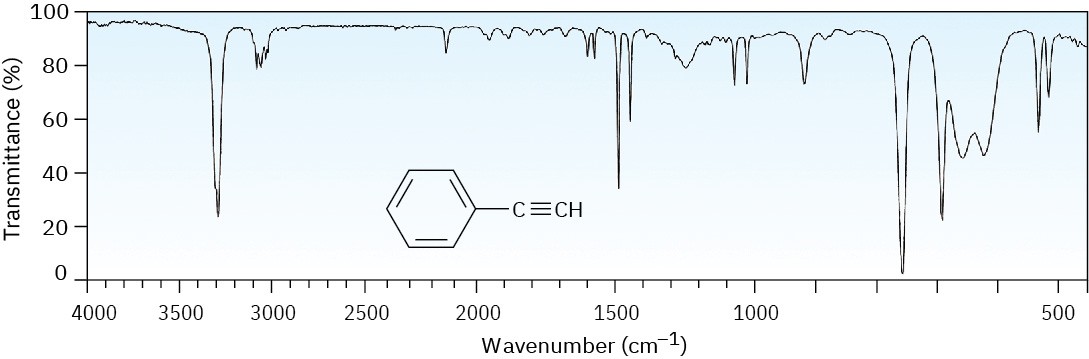
Figure 12.29 The IR spectrum of phenylacetylene, Problem 12-9. Problem 12-10
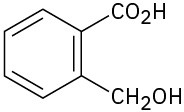
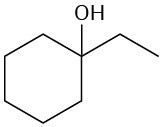
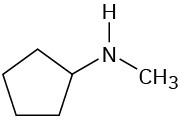
Where might the following compounds have IR absorptions? (a)
(b)
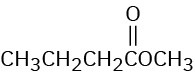
(c)
Problem 12-11
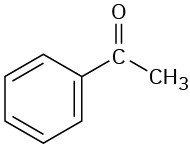
Where might the following compound have IR absorptions?
Additional Problems 12 • Additional Problems 12 • Additional Problems Visualizing Chemistry Problem 12-12
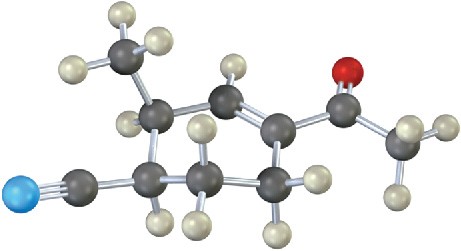
Where in the IR spectrum would you expect each of the following molecules to absorb? (a)
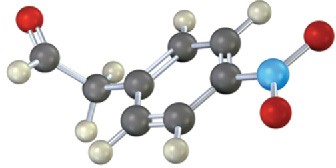
(b)
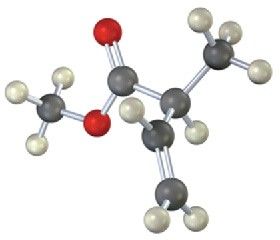
(c)
Problem 12-13
Show the structures of the fragments you would expect in the mass spectra of the following molecules:
(a)
(b)
Mass Spectrometry
Problem 12-14
Propose structures for compounds that fit the following mass-spectral data: (a)
A hydrocarbon with M+ = 132 (b)
A hydrocarbon with M+ = 166 (c)
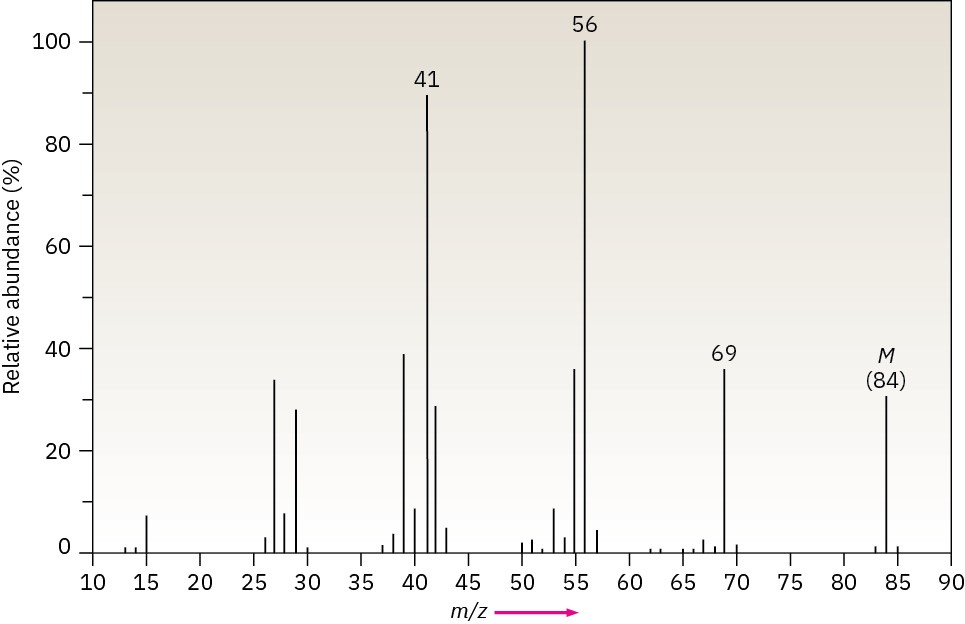
A hydrocarbon with M+ = 84 Problem 12-15
Write molecular formulas for compounds that show the following molecular ions in their high-resolution mass spectra, assuming that C, H, N, and O might be present. The exact atomic masses are: 1.007 83 (1H), 12.000 00 (12C), 14.003 07 (14N), 15.994 91 (16O).
(a)
M+ = 98.0844
(b)
M+ = 123.0320
Problem 12-16
Camphor, a saturated monoketone from the Asian camphor tree, is used among other things as a moth repellent and as a constituent of embalming fluid. If camphor has M+ = 152.1201 by high-resolution mass spectrometry, what is its molecular formula? How many rings does camphor have?
Problem 12-17
The nitrogen rule of mass spectrometry says that a compound containing an odd number of nitrogens has an odd-numbered molecular ion. Conversely, a compound containing an even number of nitrogens has an even-numbered M+ peak. Explain.
Problem 12-18
In light of the nitrogen rule mentioned in Problem 12-17, what is the molecular formula of pyridine, M+ = 79?
Problem 12-19
Nicotine is a diamino compound isolated from dried tobacco leaves. Nicotine has two rings and M+ = 162.1157 by high-resolution mass spectrometry. Give a molecular formula for nicotine, and calculate the number of double bonds.
Problem 12-20
The hormone cortisone contains C, H, and O, and shows a molecular ion at M+ = 360.1937 by high-resolution mass spectrometry. What is the molecular formula of cortisone? (The degree of unsaturation for cortisone is 8.)
Problem 12-21
Halogenated compounds are particularly easy to identify by their mass spectra because both chlorine and bromine occur naturally as mixtures of two abundant isotopes. Recall that chlorine occurs as 35Cl (75.8%) and 37Cl (24.2%); and bromine occurs as 79Br (50.7%) and 81Br (49.3%). At what masses do the molecular ions occur for the following formulas? What are the relative percentages of each molecular ion?
(a)
Bromomethane, CH3Br (b)
- Chlorohexane, C6H13Cl Problem 12-22
By knowing the natural abundances of minor isotopes, it’s possible to calculate the relative heights of M+ and M + 1 peaks. If 13C has a natural abundance of 1.10%, what are the relative heights of the M+ and M + 1 peaks in the mass spectrum of benzene, C6H6?
Problem 12-23
Propose structures for compounds that fit the following data:
(a)
A ketone with M+ = 86 and fragments at m/z = 71 and m/z = 43 (b)
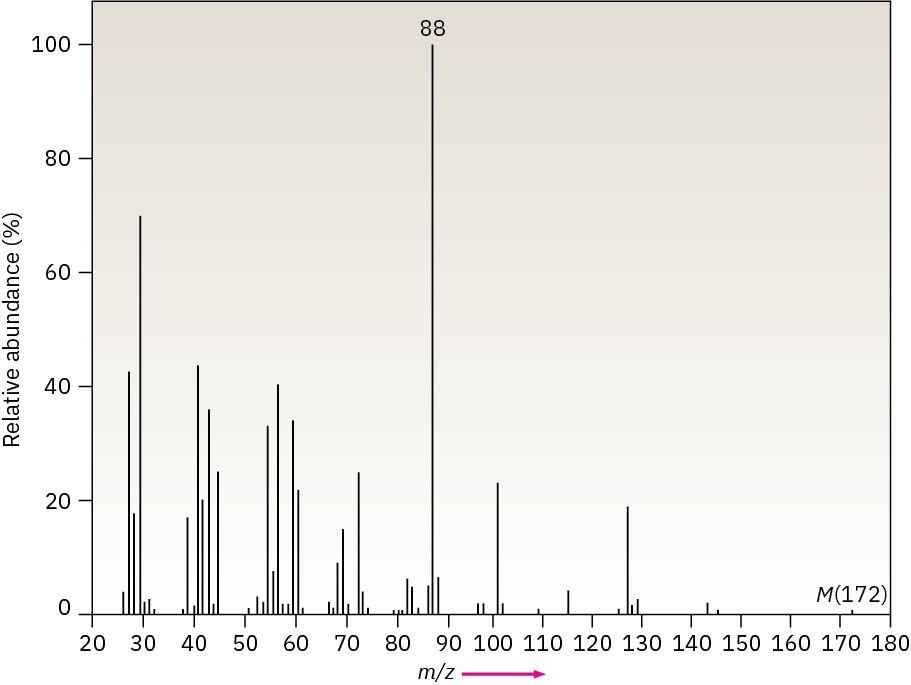
An alcohol with M+ = 88 and fragments at m/z = 73, m/z = 70, and m/z = 59 Problem 12-24
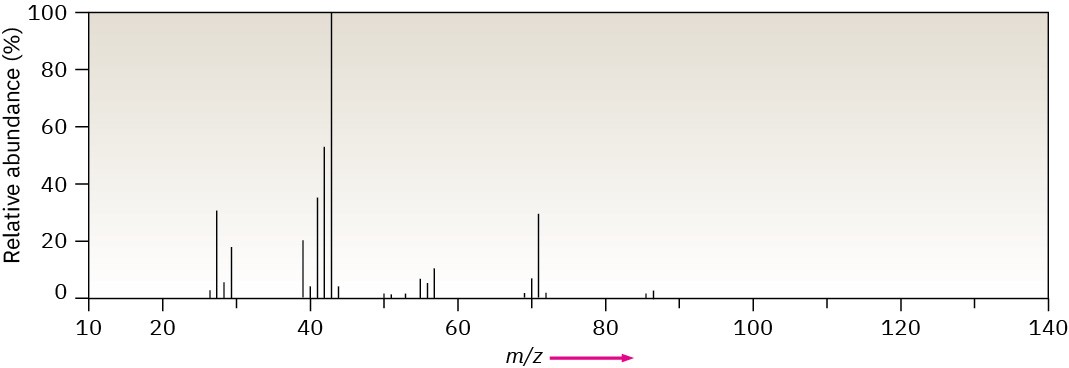
- Methylpentane (C6H14) has the mass spectrum shown. Which peak represents M+? Which is the base peak? Propose structures for fragment ions of m/z = 71, 57, 43, and 29. Why does the base peak have the mass it does?
Problem 12-25
Assume that you are in a laboratory carrying out the catalytic hydrogenation of cyclohexene to cyclohexane. How could you use a mass spectrometer to determine when the reaction is finished?
Problem 12-26
What fragments might you expect in the mass spectra of the following compounds? (a)
(b)
(c)
Infrared Spectroscopy
Problem 12-27
How might you use IR spectroscopy to distinguish among the three isomers 1-butyne, 1,3- butadiene, and 2-butyne?
Problem 12-28
Would you expect two enantiomers such as (R)-2-bromobutane and (S)-2-bromobutane to have identical or different IR spectra? Explain.
Problem 12-29
Would you expect two diastereomers such as meso-2,3-dibromobutane and (2R,3R)- dibromobutane to have identical or different IR spectra? Explain.
Problem 12-30
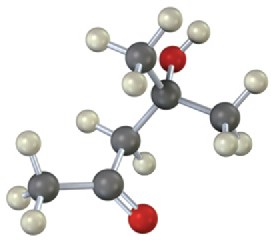
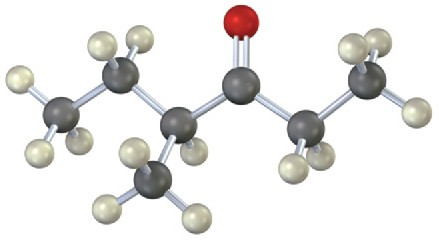
Propose structures for compounds that meet the following descriptions: (a)
C5H8, with IR absorptions at 3300 and 2150 cm–1 (b)
C4H8O, with a strong IR absorption at 3400 cm–1 (c)
C4H8O, with a strong IR absorption at 1715 cm–1 (d)
C8H10, with IR absorptions at 1600 and 1500 cm–1 Problem 12-31
How could you use infrared spectroscopy to distinguish between the following pairs of isomers?
(a)
HC≡CCH2NH2 and CH3CH2C≡N
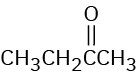
(b)
CH3COCH3 and CH3CH2CHO
Problem 12-32
Two infrared spectra are shown. One is the spectrum of cyclohexane, and the other is the spectrum of cyclohexene. Identify them, and explain your answer.
(a)
(b)
Problem 12-33
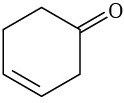
At what approximate positions might the following compounds show IR absorptions? (a)
(b)
(c)
(d)
(e)
Problem 12-34
How would you use infrared spectroscopy to distinguish between the following pairs of constitutional isomers?
(a)

(b)
(c)

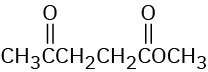
Problem 12-35
At what approximate positions might the following compounds show IR absorptions? (a)
(b)
(c)
(d)
(e)
(f)
Problem 12-36
Assume that you are carrying out the dehydration of 1-methylcyclohexanol to yield 1- methylcyclohexene. How could you use infrared spectroscopy to determine when the reaction is complete?
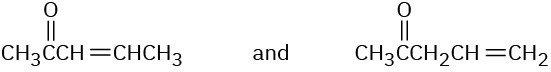
Problem 12-37
Assume that you are carrying out the base-induced dehydrobromination of 3-bromo-3- methylpentane (Section 11.7) to yield an alkene. How could you use IR spectroscopy to tell which of three possible elimination products is formed, if one includes E/Z isomers?
General Problems
Problem 12-38
Which is stronger, the C=O bond in an ester (1735 cm–1) or the C=O bond in a saturated ketone (1715 cm–1)? Explain.
Problem 12-39
Carvone is an unsaturated ketone responsible for the odor of spearmint. If carvone has M+
= 150 in its mass spectrum and contains three double bonds and one ring, what is its molecular formula?
Problem 12-40
Carvone (Problem 12-39) has an intense infrared absorption at 1690 cm–1. What kind of ketone does carvone contain?
Problem 12-41
The mass spectrum (a) and the infrared spectrum (b) of an unknown hydrocarbon are shown. Propose as many structures as you can.
(a)
(b)
Problem 12-42
The mass spectrum (a) and the infrared spectrum (b) of another unknown hydrocarbon are shown. Propose as many structures as you can.
(a)
(b)
Problem 12-43
Propose structures for compounds that meet the following descriptions: (a)
An optically active compound C5H10O with an IR absorption at 1730 cm–1 (b)
A non-optically active compound C5H9N with an IR absorption at 2215 cm–1 Problem 12-44
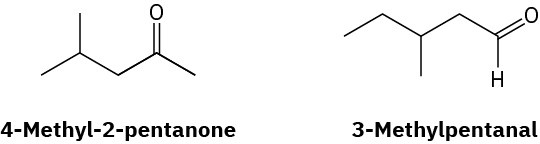
4-Methyl-2-pentanone and 3-methylpentanal are isomers. Explain how you could tell them apart, both by mass spectrometry and by infrared spectroscopy.
Problem 12-45
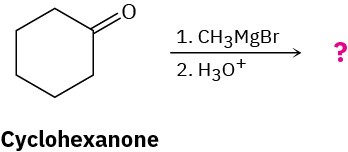
Grignard reagents (alkylmagnesium halides) undergo a general and very useful reaction with ketones. Methylmagnesium bromide, for example, reacts with cyclohexanone to yield a product with the formula C7H14O. What is the structure of this product if it has an IR absorption at 3400 cm–1?
Problem 12-46
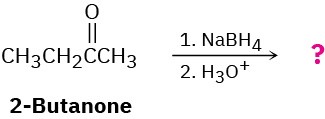
Ketones undergo a reduction when treated with sodium borohydride, NaBH4. What is the structure of the compound produced by reaction of 2-butanone with NaBH4 if it has an IR absorption at 3400 cm–1 and M+ = 74 in the mass spectrum?
Problem 12-47
Nitriles, R–C≡N, undergo a hydrolysis reaction when heated with aqueous acid. What is the structure of the compound produced by hydrolysis of propanenitrile, CH3CH2C≡N, if it has IR absorptions from 2500–3100 cm–1 and at 1710 cm–1, and has M+ = 74?
Problem 12-48
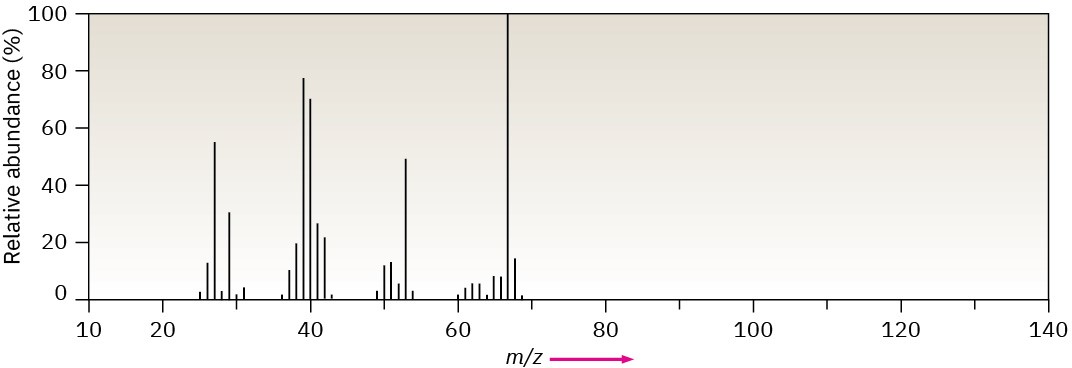
The infrared spectrum of the compound with the following mass spectrum lacks any significant absorption above 3000 cm–1. There is a prominent peak near 1740 cm–1 and another strong peak near 1200 cm–1. Propose a structure.
Problem 12-49
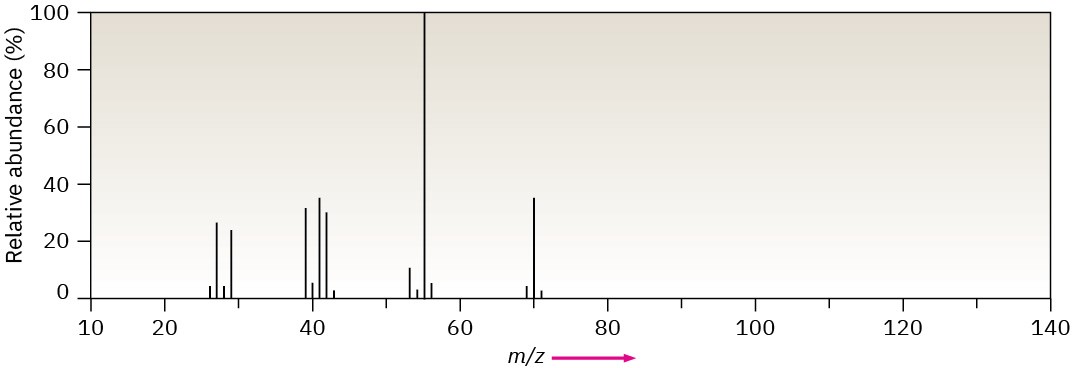
The infrared spectrum of the compound with the following mass spectrum has a medium- intensity peak at about 1650 cm–1. There is also a C–H out-of-plane bending peak near 880 cm–1. Propose a structure.
Problem 12-50
The infrared spectrum of the compound with the following mass spectrum has strong absorbances at 1584, 1478, and 1446 cm–1. Propose a structure.