
Chemistry Matters — X-Ray Crystallography
The various spectroscopic techniques described in this and the next two chapters are enormously important in chemistry and have been fine-tuned to such a degree that the structure of almost any molecule can be found. Nevertheless, wouldn’t it be nice if you could simply look at a molecule and “see” its structure with your eyes?
Determining the three-dimensional shape of an object around you is easy—you just look at it, let your eyes focus the light rays reflected from the object, and let your brain assemble the data into a recognizable image. If the object is small, you use a microscope and let the microscope lens focus the visible light. Unfortunately, there is a limit to what you can see, even with the best optical microscope. Called the diffraction limit, you can’t see anything smaller than the wavelength of light you are using for the observation. Visible light has wavelengths of several hundred nanometers, but atoms in molecules have dimensions on the order of 0.1 nm. Thus, to see a molecule—whether a small one in the laboratory or a large, complex enzyme with a molecular weight in the tens of thousands—you need wavelengths in the 0.1 nm range, which corresponds to X rays.
Let’s say that we want to determine the structure and shape of an enzyme or other biological molecule. The technique used is called X-ray crystallography. First, the molecule is crystallized (which often turns out to be the most difficult and time-consuming part of the entire process) and a small crystal of 0.4 to 0.5 mm on its longest axis is glued to the end of a glass fiber. The fiber and attached crystal are then mounted in an instrument called an X-ray diffractometer, which consists of a radiation source, a sample positioning and orienting device that can rotate the crystal in any direction, a detector, and a controlling computer.
Once mounted in the diffractometer, the crystal is irradiated with X rays, usually so-called CuKα radiation with a wavelength of 0.154 nm. When the X rays strike the enzyme crystal, they interact with electrons in the molecule and are scattered into a diffraction pattern which, when detected and visualized, appears as a series of intense spots against a null background.
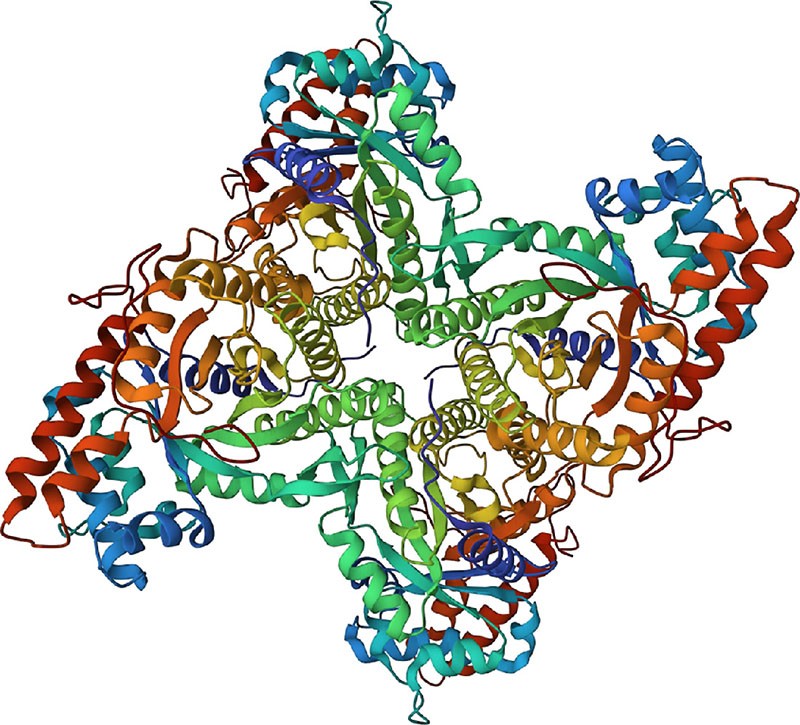
Figure 12.30 The structure of human muscle fructose-1,6-bisphosphate aldolase, as determined by X-ray crystallography. (credit: modification of work Protein Data Bank, 1ALD. PDB ID: 1ALD, Gamblin, S.J. Davies, G.J. Grimes, J.M. Jackson, R.M. Littlechild, J.A. Watson, H.C. (1991) J. Mol. Biol. 219: 573-576, CC BY 1.0.)
Manipulation of the diffraction pattern to extract three-dimensional molecular data is a complex process, but the final result is an electron-density map of the molecule. Because electrons are largely localized around atoms, any two centers of electron density located within bonding distance of each other are assumed to represent bonded atoms, leading to a recognizable chemical structure. So important is this structural information for biochemistry that an online database of approximately 145,000 biological substances has been created. Operated by Rutgers University and funded by the U.S. National Science Foundation, the Protein Data Bank (PDB) is a worldwide repository for processing and distributing three-dimensional structural data for biological macromolecules. We’ll see how to access the PDB in the Chapter 26 Chemistry Matters.
