13.5 Integration of 1H NMR Absorptions: Proton Counting
Look at the 1H NMR spectrum of methyl 2,2-dimethylpropanoate in Figure 13.7. There are two peaks, corresponding to the two kinds of protons, but the peaks aren’t the same size. The peak at 1.2 δ, due to the (CH3)3C– protons, is larger than the peak at 3.7 δ, due to the – OCH3 protons.
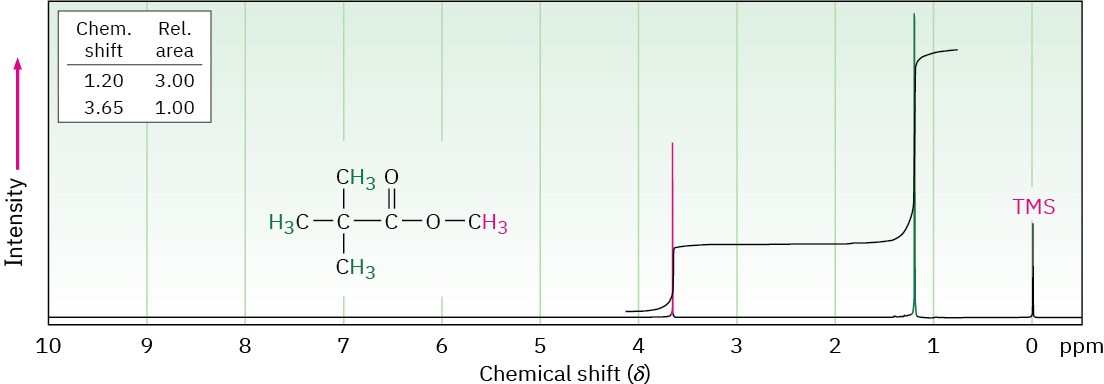
Figure 13.7 The 1H NMR spectrum of methyl 2,2-dimethylpropanoate. Integrating the peaks in a stair-step manner shows that they have a 1 : 3 ratio, corresponding to the ratio of the numbers of protons (3 : 9) responsible for each peak. Modern instruments give a direct digital readout of relative peak areas.
The area under each peak is proportional to the number of protons causing that peak. By electronically measuring, or integrating, the area under each peak, it’s possible to measure the relative numbers of the different kinds of protons in a molecule.
Modern NMR instruments provide a digital readout of relative peak areas, but an older, more visual method displays the integrated peak areas as a stair-step line, with the height of each step proportional to the area under the peak, and therefore proportional to the relative number of protons causing the peak. For example, the two steps for the peaks in methyl 2,2-dimethylpropanoate have a 1 : 3 (or 3 : 9) height ratio when integrated—exactly what we expect because the three −OCH3 protons are equivalent and the nine (CH3)3C– protons are equivalent.
Problem 13-8
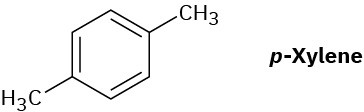
How many peaks would you expect in the 1H NMR spectrum of 1,4-dimethylbenzene (para– xylene, or p-xylene)? What ratio of peak areas would you expect on integration of the spectrum? Refer to Table 13.3 for approximate chemical shifts, and sketch what the spectrum would look like. (Remember from Section 2.4 that aromatic rings have two resonance forms.)