
12.7 Interpreting Infrared Spectra
The complete interpretation of an IR spectrum is difficult because most organic molecules have dozens of different bond stretching and bending motions, and thus have dozens of absorptions. On the one hand, this complexity is a problem because it generally limits the laboratory use of IR spectroscopy to pure samples of fairly small molecules—little can be learned from IR spectroscopy about large, complex biomolecules. On the other hand, this complexity is useful because an IR spectrum acts as a unique fingerprint of a compound. In fact, the complex region of the IR spectrum, from 1500 cm–1 to around 400 cm–1, is called the fingerprint region. If two samples have identical IR spectra, they are almost certainly identical compounds.
Fortunately, we don’t need to interpret an IR spectrum fully to get useful structural information. Most functional groups have characteristic IR absorption bands that don’t change much from one compound to another. The C=O absorption of a ketone is almost always in the range 1680 to 1750 cm–1; the O–H absorption of an alcohol is almost always in the range 3400 to 3650 cm–1; the C=C absorption of an alkene is almost always in the range 1640 to 1680 cm–1; and so forth. By learning where characteristic functional-group absorptions occur, it’s possible to get structural information from IR spectra. Table 12.1 lists the characteristic IR bands of some common functional groups.
Table 12.1 Characteristic IR Absorptions of Some Functional Groups
|
Functional Group |
|
Absorption (cm–1) |
Intensity |
|
Alkane |
C–H |
2850–2960 |
Medium |
|
Alkene |
=C–H |
3020–3100 |
Medium |
|
C=C |
1640–1680 |
Medium |
|
|
Alkyne |
≡C–H |
3300 |
Strong |
|
C≡C |
2100–2260 |
Medium |
|
|
Alkyl halide |
C–Cl |
600–800 |
Strong |
|
C–Br |
500–600 |
Strong |
|
|
Alcohol |
O–H |
3400–3650 |
Strong, broad |
|
C–O |
1050–1150 |
Strong |
|
|
Arene |
C–H |
3030 |
Weak |
|
Aromatic ring |
|
1660–2000 |
Weak |
|
1450–1600 |
Medium |
||
|
Amine |
N–H |
3300–3500 |
Medium |
|
C–N |
1030–1230 |
Medium |
|
|
Carbonyl compound |
C═O |
1670–1780 |
Strong |
|
|
Absorption (cm–1) |
Intensity |
|
|
|
Aldehyde |
1730 |
Strong |
|
Ketone |
1715 |
Strong |
|
|
Ester |
1735 |
Strong |
|
|
Amide |
1690 |
Strong |
|
|
Carboxylic acid |
1710 |
Strong |
|
|
Carboxylic acid |
O–H |
2500–3100 |
Strong, broad |
|
Nitrile |
C≡N |
2210–2260 |
Medium |
|
Nitro |
NO2 |
1540 |
Strong |
Look at the IR spectra of hexane, 1-hexene, and 1-hexyne in Figure 12.21 to see an example of how IR spectroscopy can be used. Although all three IR spectra contain many peaks, there are characteristic absorptions of C═C and C≡C functional groups that allow the three compounds to be distinguished. Thus, 1-hexene shows a characteristic C═C absorption at 1660 cm–1 and a vinylic =C–H absorption at 3100 cm–1, whereas 1-hexyne has a C≡C absorption at 2100 cm–1 and a terminal alkyne ≡C– H absorption at 3300 cm–1.
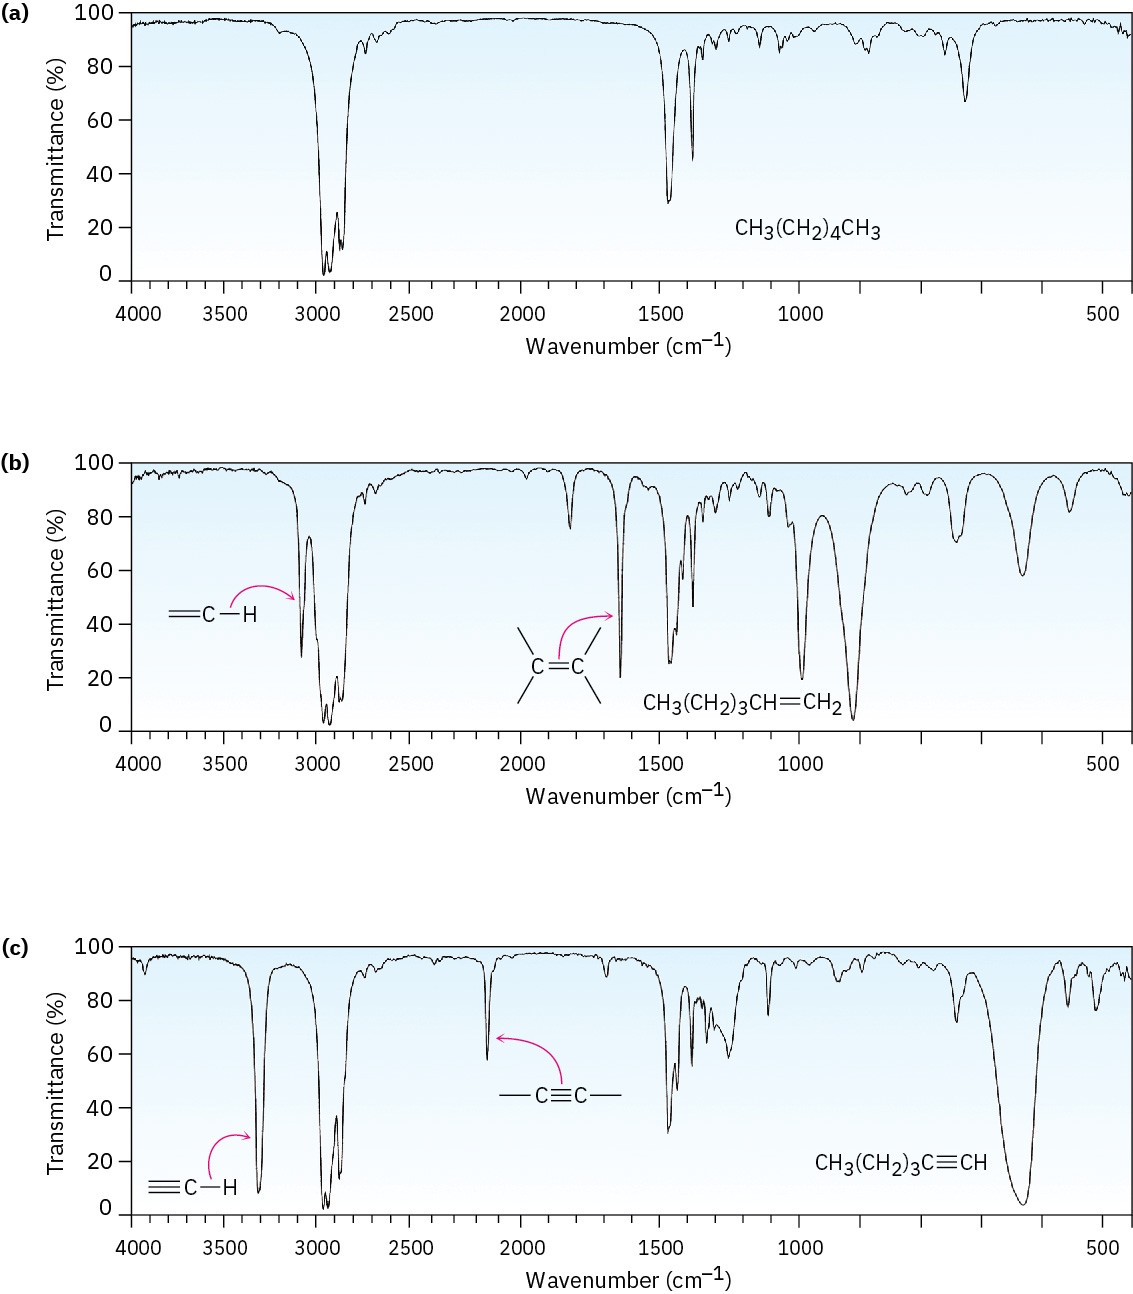
Figure 12.21 IR spectra of (a) hexane, (b) 1-hexene, and (c) 1-hexyne. Spectra like these are easily obtained from sub-milligram amounts of material in a few minutes using commercially available instruments.
It helps in remembering the position of specific IR absorptions to divide the IR region from 4000 cm–1 to 400 cm–1 into four parts, as shown in Figure 12.22.
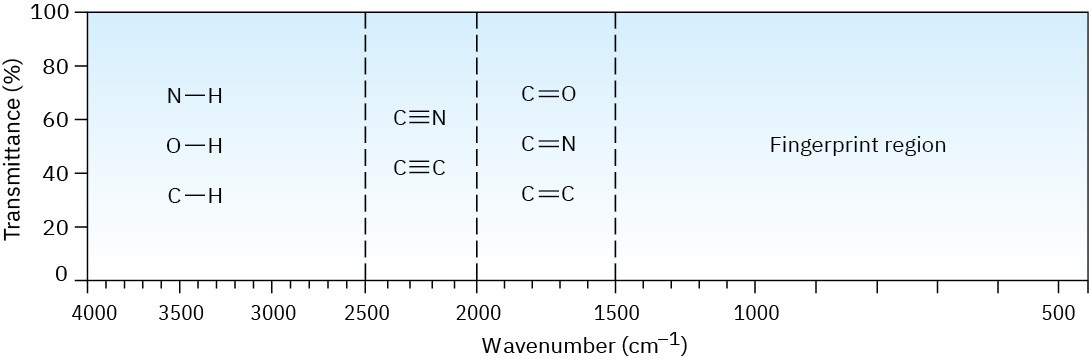
Figure 12.22The four regions of the infrared spectrum: single bonds to hydrogen, triple bonds, double bonds, and fingerprint.
- The region from 4000 to 2500 cm–1 corresponds to absorptions caused by N–H, C–H, and O–H single-bond stretching motions. N–H and O–H bonds absorb in the 3300 to 3600 cm–1 range; C–H bond stretching occurs near 3000 cm–1.
- The region from 2500 to 2000 cm–1 is where triple-bond stretching occurs. Both C≡N and C≡C bonds absorb here.
- The region from 2000 to 1500 cm–1 is where double bonds (C═O, C═N, and C═C) absorb. Carbonyl groups generally absorb in the range 1680 to 1750 cm–1, and alkene stretching normally occurs in the narrow range of 1640 to 1680 cm–1.
- The region below 1500 cm–1 is the fingerprint portion of the IR spectrum. A large number of absorptions due to a variety of C–C, C–O, C–N, and C–X single-bond vibrations occur here.
Why do different functional groups absorb where they do? As noted previously, a good analogy is that of two weights (atoms) connected by a spring (a bond). Short, strong bonds vibrate at a higher energy and higher frequency than do long, weak bonds, just as a short, strong spring vibrates faster than a long, weak spring. Thus, triple bonds absorb at a higher frequency than double bonds, which in turn absorb at a higher frequency than single bonds. In addition, C–H, O–H, and N–H bonds vibrate at a higher frequency than bonds between heavier C, O, and N atoms.
Worked Example 12.4Distinguishing Isomeric Compounds by IR SpectroscopyAcetone (CH3COCH3) and 2-propen-1-ol (H!C═CHCH!OH) are isomers. How could you distinguish them by IR spectroscopy?StrategyIdentify the functional groups in each molecule, and refer to Table 12.1.SolutionAcetone has a strong C=O absorption at 1715 cm–1, while 2-propen-1-ol has an –OH absorption at 3500 cm–1 and a C=C absorption at 1660 cm–1.
Problem 12-7
What functional groups might the following molecules contain? (a)
A compound with a strong absorption at 1710 cm–1 (b)
A compound with a strong absorption at 1540 cm–1 (c)
A compound with strong absorptions at 1720 cm–1 and 2500 to 3100 cm–1 Problem 12-8
How might you use IR spectroscopy to distinguish between the following pairs of isomers? (a)
CH3CH2OH and CH3OCH3
(b)
Cyclohexane and 1-hexene (c)
CH3CH2CO2H and HOCH2CH2CHO
