13.3 Chemical Shifts
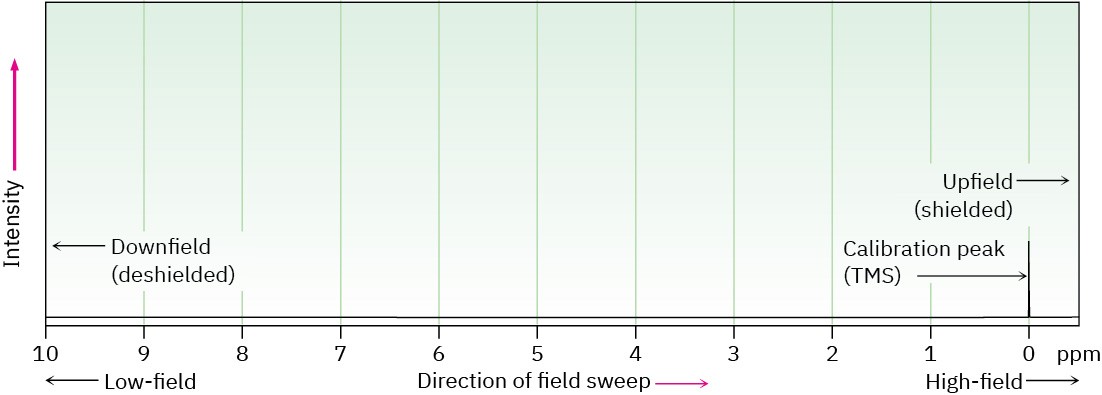
NMR spectra are displayed on charts that show the applied field strength increasing from left to right (Figure 13.6). Thus, the left part of the chart is the low-field, or downfield, side, and the right part is the high-field, or upfield, side. Nuclei that absorb on the downfield side of the chart require a lower field strength for resonance, implying that they have less shielding. Nuclei that absorb on the upfield side require a higher field strength for resonance, implying that they have more shielding.

Figure 13.6 The NMR chart. The downfield, deshielded side is on the left, and the upfield, shielded side is on the right. The tetramethylsilane (TMS) absorption is used as reference point.
To define the position of an absorption, the NMR chart is calibrated and a reference point is used. In practice, a small amount of tetramethylsilane [TMS; (CH3)4Si] is added to the sample so that a reference absorption peak is produced when the spectrum is run. TMS is used as reference for both 1H and 13C measurements because in both cases it produces a single peak that occurs upfield of other absorptions normally found in organic compounds. The 1H and 13C spectra of methyl acetate in Figure 13.4 have the TMS reference peak indicated.
The position on the chart at which a nucleus absorbs is called its chemical shift. The chemical shift of TMS is set as the zero point, and other absorptions normally occur downfield, to the left on the chart. NMR charts are calibrated using an arbitrary scale called the delta (δ) scale, where 1 δ equals 1 part-per-million (1 ppm) of the spectrometer operating frequency. For example, if we were measuring the 1H NMR spectrum of a sample using an instrument operating at 200 MHz, 1 δ would be 1 part per million of 200,000,000 Hz, or 200 Hz. If we were measuring the spectrum using a 500 MHz instrument, 1 δ = 500 Hz. The following equation can be used for any absorption:
𝛿 = Observed chemical shift (number of Hz away from TMS) Spectrometer frequency in MHz
Although this method of calibrating NMR charts may seem complex, there’s a good reason for it. As we saw earlier, the rf frequency required to bring a given nucleus into resonance depends on the spectrometer’s magnetic field strength. But because there are many different kinds of spectrometers with many different magnetic field strengths available, chemical shifts given in frequency units (Hz) vary from one instrument to another. Thus, a resonance that occurs at 120 Hz downfield from TMS on one spectrometer might occur at 600 Hz downfield from TMS on another spectrometer with a more powerful magnet.
By using a system of measurement in which NMR absorptions are expressed in relative terms (parts per million relative to spectrometer frequency) rather than absolute terms (Hz), it’s possible to compare spectra obtained on different instruments. The chemical shift of an NMR absorption in δ units is constant, regardless of the operating frequency of the spectrometer. A 1H nucleus that absorbs at 2.0 δ on a 200 MHz instrument also absorbs at
2.0 δ on a 500 MHz instrument.
The range in which most NMR absorptions occur is quite narrow. Almost all 1H NMR absorptions occur from 0 to 10 δ downfield from the proton absorption of TMS, and almost all 13C absorptions occur from 1 to 220 δ downfield from the carbon absorption of TMS. Thus, there is a likelihood that accidental overlap of nonequivalent signals will occur. The advantage of using an instrument with higher field strength (say, 500 MHz) rather than lower field strength (200 MHz) is that different NMR absorptions are more widely separated at the higher field strength. The chances that two signals will accidentally overlap are therefore lessened, and interpretation of spectra becomes easier. For example, two signals that are only 20 Hz apart at 200 MHz (0.1 ppm) are 50 Hz apart at 500 MHz (still 0.1 ppm).
Problem 13-4
The following 1H NMR peaks were recorded on a spectrometer operating at 200 MHz. Convert each into δ units.
(a)
CHCl3; 1454 Hz
(b)
CH3Cl; 610 Hz
(c)
CH3OH; 693 Hz
(d)
CH2Cl2; 1060 Hz
Problem 13-5
When the 1H NMR spectrum of acetone, CH3COCH3, is recorded on an instrument operating at 200 MHz, a single sharp resonance at 2.1 δ is seen.
(a)
How many hertz downfield from TMS does the acetone resonance correspond to? (b)
If the 1H NMR spectrum of acetone is recorded at 500 MHz, what would the position of the absorption be in δ units?
(c)
How many hertz downfield from TMS does this 500 MHz resonance correspond to?

